Sri Lankan vs Immigrants from Sweden In Labor Force | Age 20-24
COMPARE
Sri Lankan
Immigrants from Sweden
In Labor Force | Age 20-24
In Labor Force | Age 20-24 Comparison
Sri Lankans
Immigrants from Sweden
74.9%
IN LABOR FORCE | AGE 20-24
34.9/ 100
METRIC RATING
185th/ 347
METRIC RANK
74.2%
IN LABOR FORCE | AGE 20-24
4.6/ 100
METRIC RATING
229th/ 347
METRIC RANK
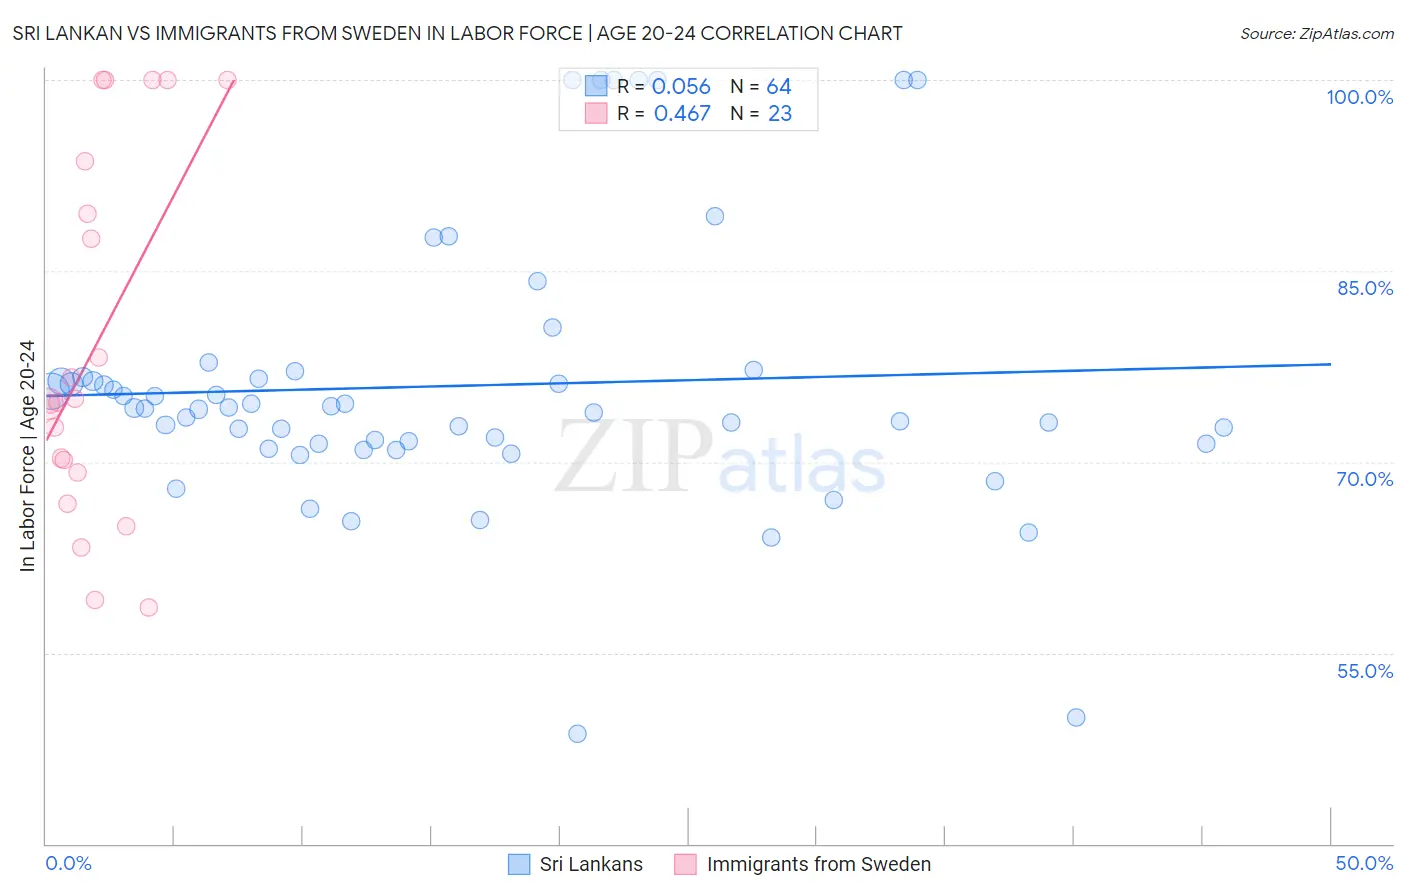
Sri Lankan vs Immigrants from Sweden In Labor Force | Age 20-24 Correlation Chart
The statistical analysis conducted on geographies consisting of 440,468,605 people shows a slight positive correlation between the proportion of Sri Lankans and labor force participation rate among population between the ages 20 and 24 in the United States with a correlation coefficient (R) of 0.056 and weighted average of 74.9%. Similarly, the statistical analysis conducted on geographies consisting of 164,691,562 people shows a moderate positive correlation between the proportion of Immigrants from Sweden and labor force participation rate among population between the ages 20 and 24 in the United States with a correlation coefficient (R) of 0.467 and weighted average of 74.2%, a difference of 0.89%.
In Labor Force | Age 20-24 Correlation Summary
| Measurement | Sri Lankan | Immigrants from Sweden |
| Minimum | 48.6% | 58.6% |
| Maximum | 100.0% | 100.0% |
| Range | 51.4% | 41.4% |
| Mean | 76.0% | 79.1% |
| Median | 74.2% | 74.7% |
| Interquartile 25% (IQ1) | 71.4% | 69.2% |
| Interquartile 75% (IQ3) | 76.6% | 93.6% |
| Interquartile Range (IQR) | 5.2% | 24.4% |
| Standard Deviation (Sample) | 10.7% | 14.1% |
| Standard Deviation (Population) | 10.6% | 13.8% |
Similar Demographics by In Labor Force | Age 20-24
Demographics Similar to Sri Lankans by In Labor Force | Age 20-24
In terms of in labor force | age 20-24, the demographic groups most similar to Sri Lankans are Immigrants from Hungary (74.9%, a difference of 0.0%), Immigrants from Eastern Europe (74.9%, a difference of 0.020%), Immigrants from Honduras (74.9%, a difference of 0.020%), Immigrants from South Africa (74.9%, a difference of 0.030%), and Immigrants from Costa Rica (74.9%, a difference of 0.030%).
| Demographics | Rating | Rank | In Labor Force | Age 20-24 |
| Immigrants | Central America | 45.0 /100 | #178 | Average 75.0% |
| Immigrants | Latvia | 44.1 /100 | #179 | Average 75.0% |
| Immigrants | Czechoslovakia | 44.0 /100 | #180 | Average 75.0% |
| Africans | 42.5 /100 | #181 | Average 75.0% |
| Immigrants | South Africa | 36.9 /100 | #182 | Fair 74.9% |
| Immigrants | Costa Rica | 36.7 /100 | #183 | Fair 74.9% |
| Immigrants | Hungary | 35.0 /100 | #184 | Fair 74.9% |
| Sri Lankans | 34.9 /100 | #185 | Fair 74.9% |
| Immigrants | Eastern Europe | 33.8 /100 | #186 | Fair 74.9% |
| Immigrants | Honduras | 33.5 /100 | #187 | Fair 74.9% |
| Hondurans | 32.7 /100 | #188 | Fair 74.8% |
| Immigrants | Northern Europe | 32.6 /100 | #189 | Fair 74.8% |
| Russians | 32.2 /100 | #190 | Fair 74.8% |
| Senegalese | 28.1 /100 | #191 | Fair 74.8% |
| Immigrants | Europe | 27.5 /100 | #192 | Fair 74.8% |
Demographics Similar to Immigrants from Sweden by In Labor Force | Age 20-24
In terms of in labor force | age 20-24, the demographic groups most similar to Immigrants from Sweden are Immigrants from Albania (74.2%, a difference of 0.030%), Immigrants from Ukraine (74.2%, a difference of 0.040%), Immigrants from Greece (74.2%, a difference of 0.040%), Immigrants from Switzerland (74.2%, a difference of 0.050%), and Immigrants from Fiji (74.3%, a difference of 0.090%).
| Demographics | Rating | Rank | In Labor Force | Age 20-24 |
| Immigrants | India | 9.9 /100 | #222 | Tragic 74.4% |
| Hispanics or Latinos | 7.9 /100 | #223 | Tragic 74.4% |
| Seminole | 6.9 /100 | #224 | Tragic 74.3% |
| Ghanaians | 6.2 /100 | #225 | Tragic 74.3% |
| Immigrants | Fiji | 5.9 /100 | #226 | Tragic 74.3% |
| Immigrants | Ireland | 5.8 /100 | #227 | Tragic 74.3% |
| Immigrants | Ukraine | 5.1 /100 | #228 | Tragic 74.2% |
| Immigrants | Sweden | 4.6 /100 | #229 | Tragic 74.2% |
| Immigrants | Albania | 4.3 /100 | #230 | Tragic 74.2% |
| Immigrants | Greece | 4.1 /100 | #231 | Tragic 74.2% |
| Immigrants | Switzerland | 4.1 /100 | #232 | Tragic 74.2% |
| Immigrants | Chile | 3.7 /100 | #233 | Tragic 74.1% |
| Immigrants | Immigrants | 3.6 /100 | #234 | Tragic 74.1% |
| Laotians | 3.5 /100 | #235 | Tragic 74.1% |
| Immigrants | France | 3.3 /100 | #236 | Tragic 74.1% |