Spanish American Indian vs Nepalese In Labor Force | Age 35-44
COMPARE
Spanish American Indian
Nepalese
In Labor Force | Age 35-44
In Labor Force | Age 35-44 Comparison
Spanish American Indians
Nepalese
82.5%
IN LABOR FORCE | AGE 35-44
0.0/ 100
METRIC RATING
301st/ 347
METRIC RANK
82.4%
IN LABOR FORCE | AGE 35-44
0.0/ 100
METRIC RATING
303rd/ 347
METRIC RANK
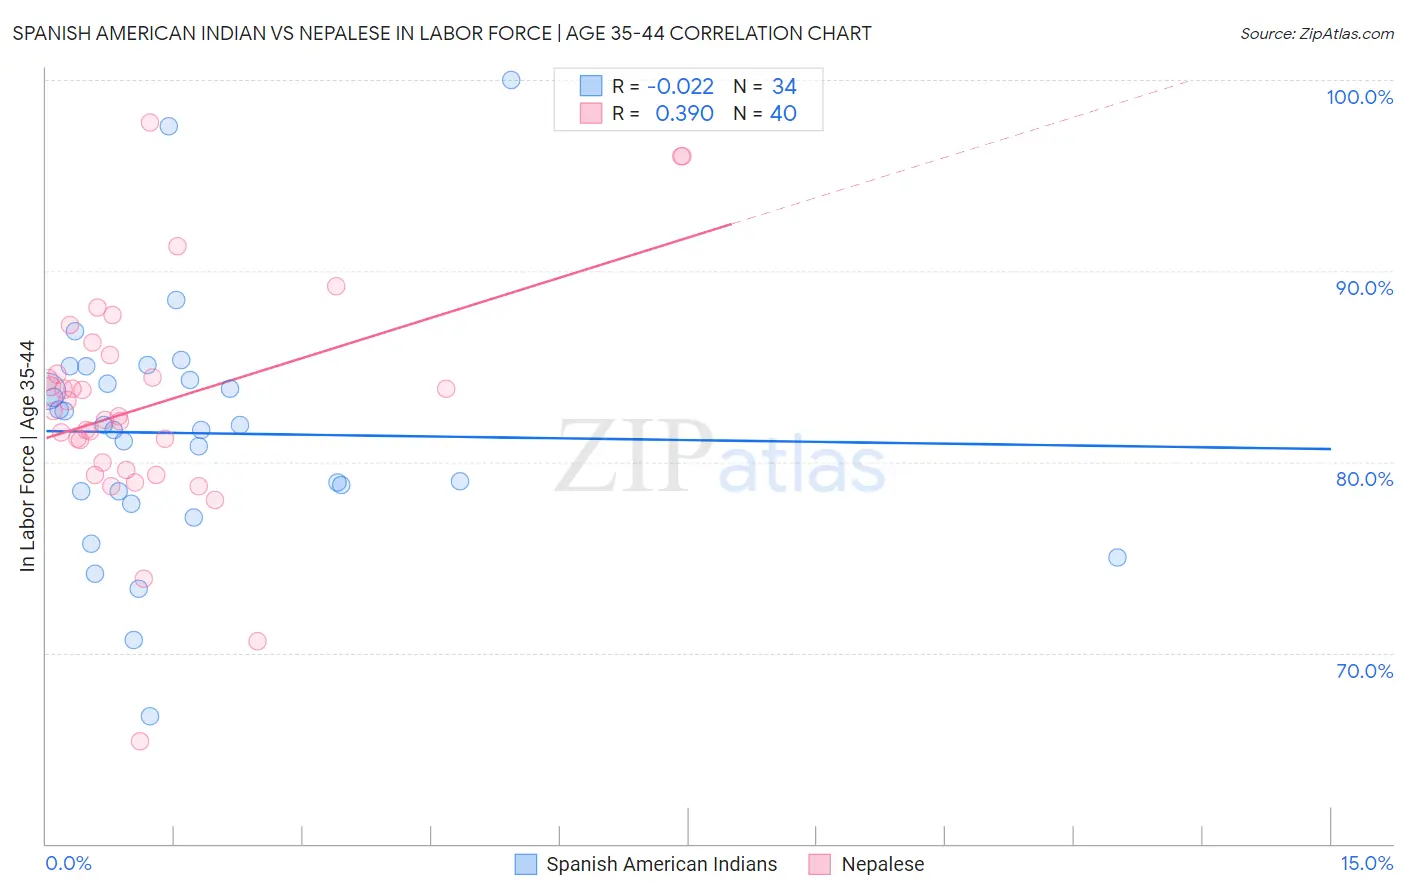
Spanish American Indian vs Nepalese In Labor Force | Age 35-44 Correlation Chart
The statistical analysis conducted on geographies consisting of 73,144,470 people shows no correlation between the proportion of Spanish American Indians and labor force participation rate among population between the ages 35 and 44 in the United States with a correlation coefficient (R) of -0.022 and weighted average of 82.5%. Similarly, the statistical analysis conducted on geographies consisting of 24,521,755 people shows a mild positive correlation between the proportion of Nepalese and labor force participation rate among population between the ages 35 and 44 in the United States with a correlation coefficient (R) of 0.390 and weighted average of 82.4%, a difference of 0.080%.
In Labor Force | Age 35-44 Correlation Summary
| Measurement | Spanish American Indian | Nepalese |
| Minimum | 66.7% | 65.4% |
| Maximum | 100.0% | 97.8% |
| Range | 33.3% | 32.4% |
| Mean | 81.5% | 83.0% |
| Median | 81.8% | 82.5% |
| Interquartile 25% (IQ1) | 78.5% | 79.8% |
| Interquartile 75% (IQ3) | 84.3% | 85.1% |
| Interquartile Range (IQR) | 5.8% | 5.3% |
| Standard Deviation (Sample) | 6.4% | 6.1% |
| Standard Deviation (Population) | 6.3% | 6.0% |
Demographics Similar to Spanish American Indians and Nepalese by In Labor Force | Age 35-44
In terms of in labor force | age 35-44, the demographic groups most similar to Spanish American Indians are Central American Indian (82.5%, a difference of 0.020%), American (82.4%, a difference of 0.080%), Marshallese (82.4%, a difference of 0.080%), Tlingit-Haida (82.5%, a difference of 0.090%), and Ottawa (82.6%, a difference of 0.10%). Similarly, the demographic groups most similar to Nepalese are American (82.4%, a difference of 0.0%), Marshallese (82.4%, a difference of 0.010%), Central American Indian (82.5%, a difference of 0.10%), Tlingit-Haida (82.5%, a difference of 0.16%), and Ottawa (82.6%, a difference of 0.18%).
| Demographics | Rating | Rank | In Labor Force | Age 35-44 |
| Immigrants | Latin America | 0.0 /100 | #292 | Tragic 82.8% |
| Spanish Americans | 0.0 /100 | #293 | Tragic 82.8% |
| Potawatomi | 0.0 /100 | #294 | Tragic 82.7% |
| Immigrants | Lebanon | 0.0 /100 | #295 | Tragic 82.7% |
| Mexican American Indians | 0.0 /100 | #296 | Tragic 82.6% |
| Hmong | 0.0 /100 | #297 | Tragic 82.6% |
| Ottawa | 0.0 /100 | #298 | Tragic 82.6% |
| Tlingit-Haida | 0.0 /100 | #299 | Tragic 82.5% |
| Central American Indians | 0.0 /100 | #300 | Tragic 82.5% |
| Spanish American Indians | 0.0 /100 | #301 | Tragic 82.5% |
| Americans | 0.0 /100 | #302 | Tragic 82.4% |
| Nepalese | 0.0 /100 | #303 | Tragic 82.4% |
| Marshallese | 0.0 /100 | #304 | Tragic 82.4% |
| Shoshone | 0.0 /100 | #305 | Tragic 82.2% |
| Blacks/African Americans | 0.0 /100 | #306 | Tragic 82.2% |
| Hispanics or Latinos | 0.0 /100 | #307 | Tragic 82.1% |
| Immigrants | Central America | 0.0 /100 | #308 | Tragic 82.0% |
| Cree | 0.0 /100 | #309 | Tragic 82.0% |
| Blackfeet | 0.0 /100 | #310 | Tragic 81.9% |
| Colville | 0.0 /100 | #311 | Tragic 81.7% |
| Alaska Natives | 0.0 /100 | #312 | Tragic 81.6% |