Soviet Union vs Guatemalan In Labor Force | Age 20-64
COMPARE
Soviet Union
Guatemalan
In Labor Force | Age 20-64
In Labor Force | Age 20-64 Comparison
Soviet Union
Guatemalans
80.2%
IN LABOR FORCE | AGE 20-64
98.5/ 100
METRIC RATING
71st/ 347
METRIC RANK
78.7%
IN LABOR FORCE | AGE 20-64
0.4/ 100
METRIC RATING
257th/ 347
METRIC RANK
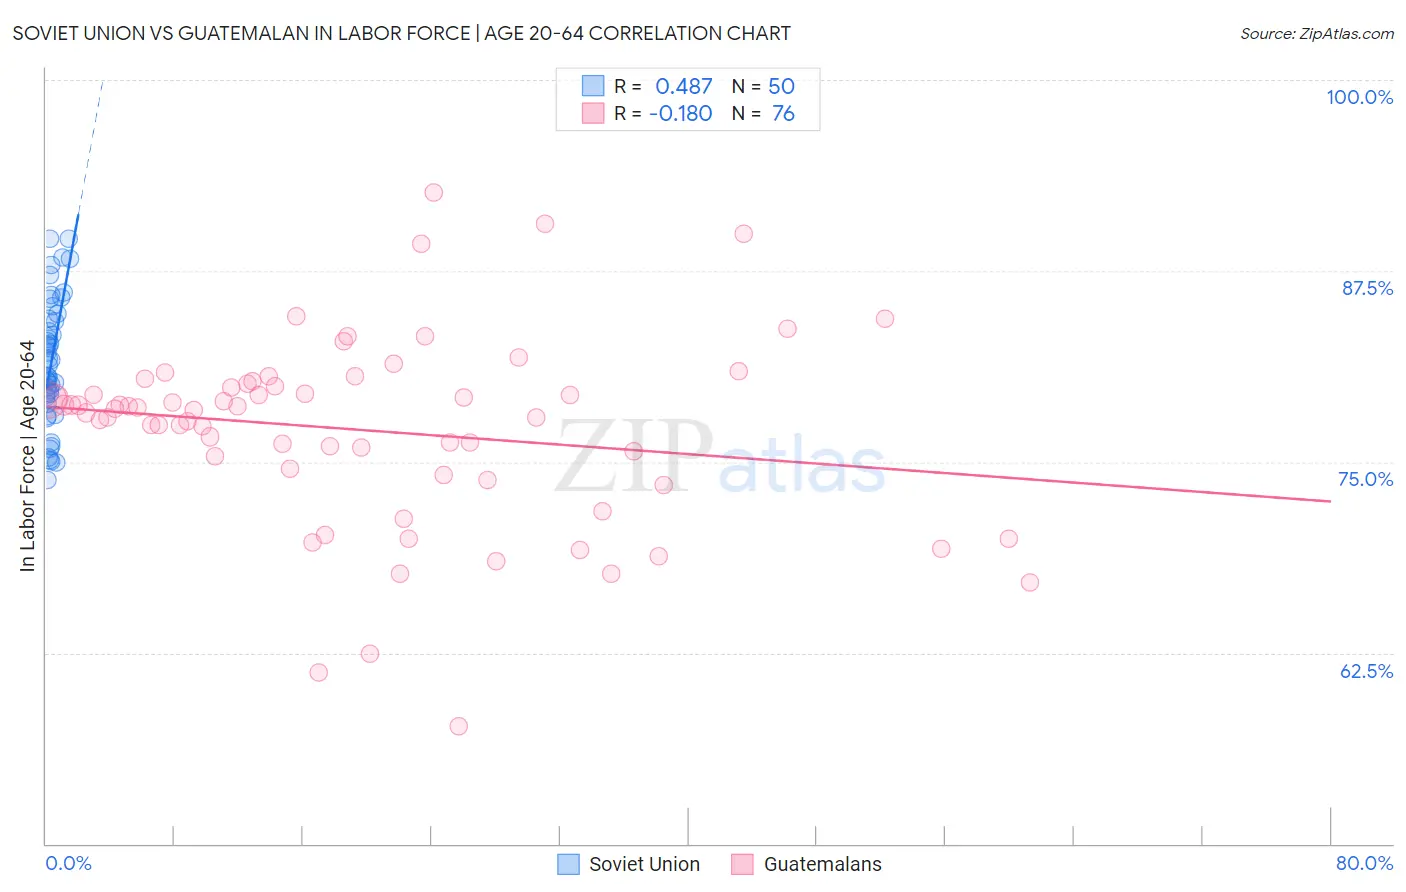
Soviet Union vs Guatemalan In Labor Force | Age 20-64 Correlation Chart
The statistical analysis conducted on geographies consisting of 43,514,626 people shows a moderate positive correlation between the proportion of Soviet Union and labor force participation rate among population between the ages 20 and 64 in the United States with a correlation coefficient (R) of 0.487 and weighted average of 80.2%. Similarly, the statistical analysis conducted on geographies consisting of 409,569,156 people shows a poor negative correlation between the proportion of Guatemalans and labor force participation rate among population between the ages 20 and 64 in the United States with a correlation coefficient (R) of -0.180 and weighted average of 78.7%, a difference of 1.9%.
In Labor Force | Age 20-64 Correlation Summary
| Measurement | Soviet Union | Guatemalan |
| Minimum | 73.8% | 57.7% |
| Maximum | 89.6% | 92.6% |
| Range | 15.8% | 34.9% |
| Mean | 81.5% | 77.1% |
| Median | 81.0% | 78.4% |
| Interquartile 25% (IQ1) | 79.2% | 74.4% |
| Interquartile 75% (IQ3) | 84.3% | 80.0% |
| Interquartile Range (IQR) | 5.1% | 5.7% |
| Standard Deviation (Sample) | 4.1% | 6.2% |
| Standard Deviation (Population) | 4.1% | 6.2% |
Similar Demographics by In Labor Force | Age 20-64
Demographics Similar to Soviet Union by In Labor Force | Age 20-64
In terms of in labor force | age 20-64, the demographic groups most similar to Soviet Union are Bhutanese (80.2%, a difference of 0.010%), Albanian (80.2%, a difference of 0.010%), Immigrants from Turkey (80.2%, a difference of 0.010%), Eastern European (80.2%, a difference of 0.010%), and Macedonian (80.2%, a difference of 0.020%).
| Demographics | Rating | Rank | In Labor Force | Age 20-64 |
| Immigrants | Albania | 98.7 /100 | #64 | Exceptional 80.3% |
| Lithuanians | 98.7 /100 | #65 | Exceptional 80.2% |
| Macedonians | 98.7 /100 | #66 | Exceptional 80.2% |
| Taiwanese | 98.6 /100 | #67 | Exceptional 80.2% |
| Bhutanese | 98.6 /100 | #68 | Exceptional 80.2% |
| Albanians | 98.6 /100 | #69 | Exceptional 80.2% |
| Immigrants | Turkey | 98.5 /100 | #70 | Exceptional 80.2% |
| Soviet Union | 98.5 /100 | #71 | Exceptional 80.2% |
| Eastern Europeans | 98.4 /100 | #72 | Exceptional 80.2% |
| Cypriots | 98.2 /100 | #73 | Exceptional 80.2% |
| Immigrants | Eastern Europe | 98.1 /100 | #74 | Exceptional 80.2% |
| Immigrants | Afghanistan | 97.9 /100 | #75 | Exceptional 80.2% |
| Egyptians | 97.8 /100 | #76 | Exceptional 80.2% |
| Immigrants | Colombia | 97.8 /100 | #77 | Exceptional 80.2% |
| Immigrants | Romania | 97.8 /100 | #78 | Exceptional 80.2% |
Demographics Similar to Guatemalans by In Labor Force | Age 20-64
In terms of in labor force | age 20-64, the demographic groups most similar to Guatemalans are Immigrants from Guatemala (78.7%, a difference of 0.0%), Hawaiian (78.7%, a difference of 0.020%), Celtic (78.7%, a difference of 0.020%), Basque (78.7%, a difference of 0.040%), and Immigrants from Lebanon (78.7%, a difference of 0.040%).
| Demographics | Rating | Rank | In Labor Force | Age 20-64 |
| Hondurans | 0.8 /100 | #250 | Tragic 78.8% |
| Barbadians | 0.7 /100 | #251 | Tragic 78.8% |
| Immigrants | Honduras | 0.6 /100 | #252 | Tragic 78.7% |
| Basques | 0.5 /100 | #253 | Tragic 78.7% |
| Immigrants | Lebanon | 0.5 /100 | #254 | Tragic 78.7% |
| Hawaiians | 0.5 /100 | #255 | Tragic 78.7% |
| Celtics | 0.5 /100 | #256 | Tragic 78.7% |
| Guatemalans | 0.4 /100 | #257 | Tragic 78.7% |
| Immigrants | Guatemala | 0.4 /100 | #258 | Tragic 78.7% |
| Tsimshian | 0.4 /100 | #259 | Tragic 78.7% |
| Immigrants | Fiji | 0.3 /100 | #260 | Tragic 78.6% |
| Whites/Caucasians | 0.2 /100 | #261 | Tragic 78.5% |
| Fijians | 0.1 /100 | #262 | Tragic 78.4% |
| Pennsylvania Germans | 0.1 /100 | #263 | Tragic 78.4% |
| Spaniards | 0.1 /100 | #264 | Tragic 78.4% |