Slovene vs Zimbabwean In Labor Force | Age 16-19
COMPARE
Slovene
Zimbabwean
In Labor Force | Age 16-19
In Labor Force | Age 16-19 Comparison
Slovenes
Zimbabweans
43.7%
IN LABOR FORCE | AGE 16-19
100.0/ 100
METRIC RATING
15th/ 347
METRIC RANK
38.7%
IN LABOR FORCE | AGE 16-19
99.1/ 100
METRIC RATING
102nd/ 347
METRIC RANK
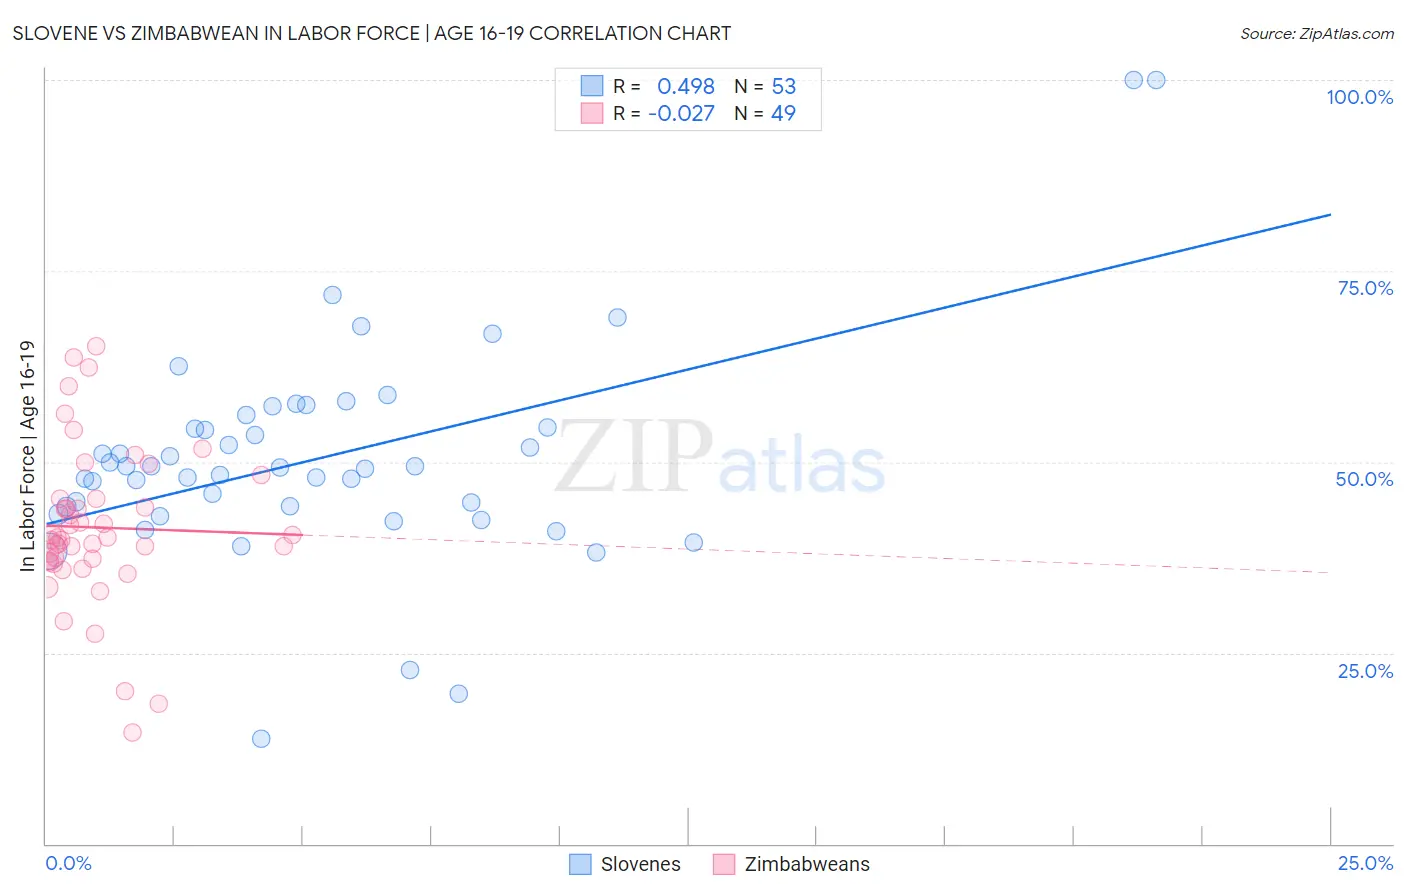
Slovene vs Zimbabwean In Labor Force | Age 16-19 Correlation Chart
The statistical analysis conducted on geographies consisting of 261,051,776 people shows a moderate positive correlation between the proportion of Slovenes and labor force participation rate among population between the ages 16 and 19 in the United States with a correlation coefficient (R) of 0.498 and weighted average of 43.7%. Similarly, the statistical analysis conducted on geographies consisting of 69,203,596 people shows no correlation between the proportion of Zimbabweans and labor force participation rate among population between the ages 16 and 19 in the United States with a correlation coefficient (R) of -0.027 and weighted average of 38.7%, a difference of 12.8%.
In Labor Force | Age 16-19 Correlation Summary
| Measurement | Slovene | Zimbabwean |
| Minimum | 13.8% | 14.6% |
| Maximum | 100.0% | 65.2% |
| Range | 86.2% | 50.6% |
| Mean | 50.5% | 41.4% |
| Median | 49.2% | 40.1% |
| Interquartile 25% (IQ1) | 43.7% | 36.9% |
| Interquartile 75% (IQ3) | 55.3% | 45.1% |
| Interquartile Range (IQR) | 11.6% | 8.2% |
| Standard Deviation (Sample) | 14.6% | 10.3% |
| Standard Deviation (Population) | 14.4% | 10.2% |
Similar Demographics by In Labor Force | Age 16-19
Demographics Similar to Slovenes by In Labor Force | Age 16-19
In terms of in labor force | age 16-19, the demographic groups most similar to Slovenes are Czech (43.6%, a difference of 0.11%), Scandinavian (43.6%, a difference of 0.17%), French Canadian (43.6%, a difference of 0.25%), Chippewa (43.8%, a difference of 0.26%), and Dutch (43.8%, a difference of 0.36%).
| Demographics | Rating | Rank | In Labor Force | Age 16-19 |
| Immigrants | Cabo Verde | 100.0 /100 | #8 | Exceptional 44.7% |
| Cape Verdeans | 100.0 /100 | #9 | Exceptional 44.5% |
| Germans | 100.0 /100 | #10 | Exceptional 44.2% |
| Swedes | 100.0 /100 | #11 | Exceptional 44.1% |
| Finns | 100.0 /100 | #12 | Exceptional 43.9% |
| Dutch | 100.0 /100 | #13 | Exceptional 43.8% |
| Chippewa | 100.0 /100 | #14 | Exceptional 43.8% |
| Slovenes | 100.0 /100 | #15 | Exceptional 43.7% |
| Czechs | 100.0 /100 | #16 | Exceptional 43.6% |
| Scandinavians | 100.0 /100 | #17 | Exceptional 43.6% |
| French Canadians | 100.0 /100 | #18 | Exceptional 43.6% |
| Belgians | 100.0 /100 | #19 | Exceptional 43.4% |
| Swiss | 100.0 /100 | #20 | Exceptional 43.3% |
| Ottawa | 100.0 /100 | #21 | Exceptional 43.0% |
| Sudanese | 100.0 /100 | #22 | Exceptional 42.9% |
Demographics Similar to Zimbabweans by In Labor Force | Age 16-19
In terms of in labor force | age 16-19, the demographic groups most similar to Zimbabweans are Hmong (38.7%, a difference of 0.010%), Immigrants from Cameroon (38.7%, a difference of 0.030%), Immigrants from Thailand (38.7%, a difference of 0.070%), Immigrants from Eritrea (38.7%, a difference of 0.090%), and Iraqi (38.6%, a difference of 0.25%).
| Demographics | Rating | Rank | In Labor Force | Age 16-19 |
| Immigrants | North America | 99.4 /100 | #95 | Exceptional 38.9% |
| Latvians | 99.4 /100 | #96 | Exceptional 38.9% |
| Greeks | 99.3 /100 | #97 | Exceptional 38.9% |
| Ugandans | 99.3 /100 | #98 | Exceptional 38.9% |
| Immigrants | North Macedonia | 99.3 /100 | #99 | Exceptional 38.9% |
| Immigrants | Thailand | 99.1 /100 | #100 | Exceptional 38.7% |
| Hmong | 99.1 /100 | #101 | Exceptional 38.7% |
| Zimbabweans | 99.1 /100 | #102 | Exceptional 38.7% |
| Immigrants | Cameroon | 99.0 /100 | #103 | Exceptional 38.7% |
| Immigrants | Eritrea | 99.0 /100 | #104 | Exceptional 38.7% |
| Iraqis | 98.9 /100 | #105 | Exceptional 38.6% |
| Delaware | 98.8 /100 | #106 | Exceptional 38.6% |
| Chinese | 98.8 /100 | #107 | Exceptional 38.6% |
| Immigrants | Ethiopia | 98.7 /100 | #108 | Exceptional 38.6% |
| Lebanese | 98.7 /100 | #109 | Exceptional 38.6% |