Slovene vs Immigrants from Belize In Labor Force | Age 45-54
COMPARE
Slovene
Immigrants from Belize
In Labor Force | Age 45-54
In Labor Force | Age 45-54 Comparison
Slovenes
Immigrants from Belize
83.9%
IN LABOR FORCE | AGE 45-54
99.8/ 100
METRIC RATING
24th/ 347
METRIC RANK
80.6%
IN LABOR FORCE | AGE 45-54
0.0/ 100
METRIC RATING
291st/ 347
METRIC RANK
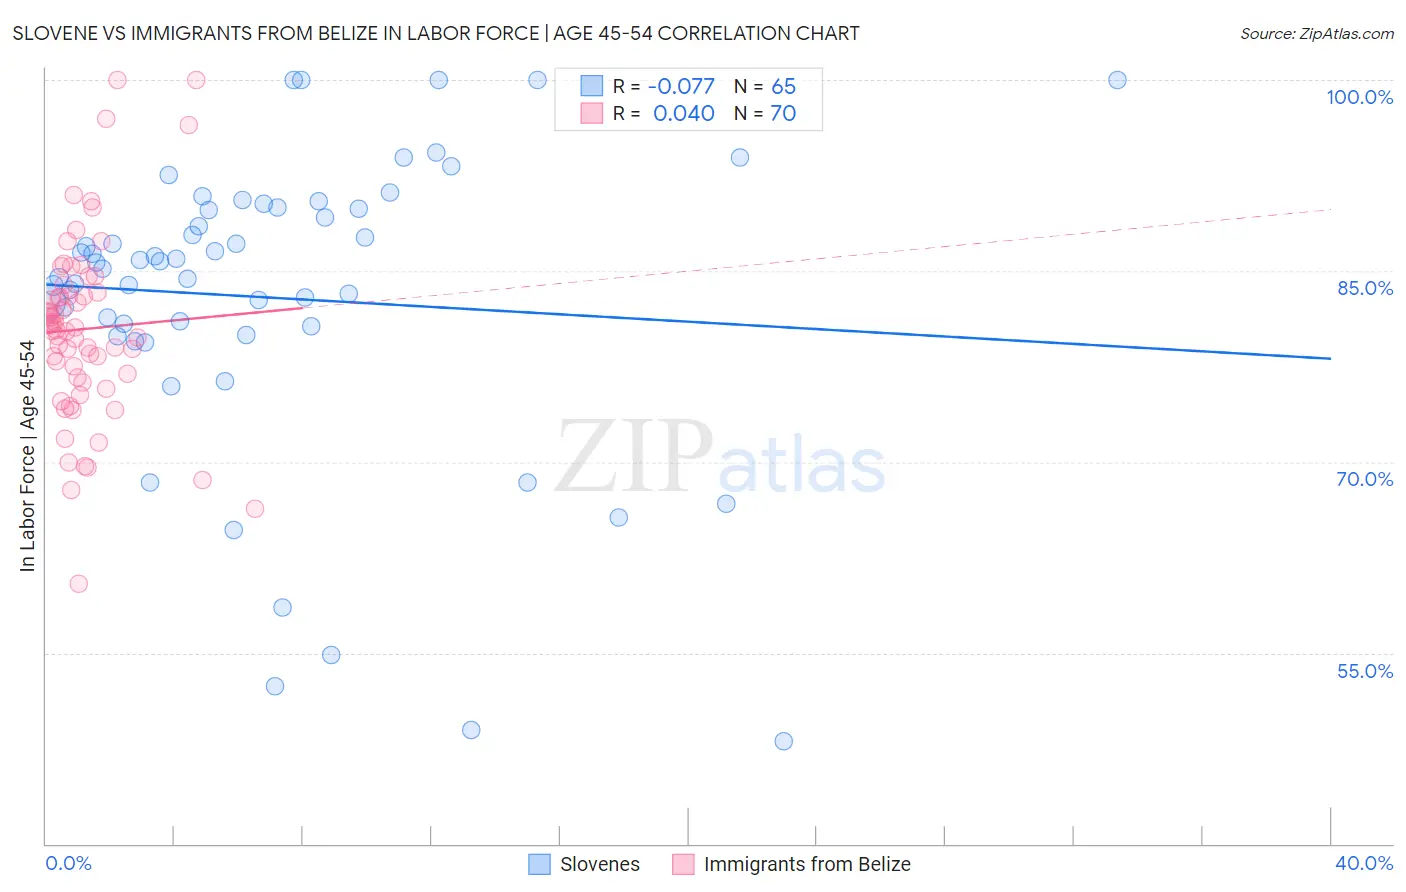
Slovene vs Immigrants from Belize In Labor Force | Age 45-54 Correlation Chart
The statistical analysis conducted on geographies consisting of 261,250,739 people shows a slight negative correlation between the proportion of Slovenes and labor force participation rate among population between the ages 45 and 54 in the United States with a correlation coefficient (R) of -0.077 and weighted average of 83.9%. Similarly, the statistical analysis conducted on geographies consisting of 130,298,014 people shows no correlation between the proportion of Immigrants from Belize and labor force participation rate among population between the ages 45 and 54 in the United States with a correlation coefficient (R) of 0.040 and weighted average of 80.6%, a difference of 4.1%.
In Labor Force | Age 45-54 Correlation Summary
| Measurement | Slovene | Immigrants from Belize |
| Minimum | 48.1% | 60.4% |
| Maximum | 100.0% | 100.0% |
| Range | 51.9% | 39.6% |
| Mean | 82.9% | 80.4% |
| Median | 85.6% | 80.5% |
| Interquartile 25% (IQ1) | 80.3% | 76.7% |
| Interquartile 75% (IQ3) | 90.0% | 83.3% |
| Interquartile Range (IQR) | 9.6% | 6.6% |
| Standard Deviation (Sample) | 11.8% | 7.3% |
| Standard Deviation (Population) | 11.7% | 7.2% |
Similar Demographics by In Labor Force | Age 45-54
Demographics Similar to Slovenes by In Labor Force | Age 45-54
In terms of in labor force | age 45-54, the demographic groups most similar to Slovenes are Immigrants from Eastern Africa (83.9%, a difference of 0.010%), Immigrants from Sri Lanka (83.9%, a difference of 0.010%), Immigrants from Ireland (83.9%, a difference of 0.010%), Tlingit-Haida (83.9%, a difference of 0.010%), and Czech (83.9%, a difference of 0.030%).
| Demographics | Rating | Rank | In Labor Force | Age 45-54 |
| Zimbabweans | 99.9 /100 | #17 | Exceptional 84.0% |
| Immigrants | South Central Asia | 99.9 /100 | #18 | Exceptional 84.0% |
| Czechs | 99.8 /100 | #19 | Exceptional 83.9% |
| Immigrants | Eastern Africa | 99.8 /100 | #20 | Exceptional 83.9% |
| Immigrants | Sri Lanka | 99.8 /100 | #21 | Exceptional 83.9% |
| Immigrants | Ireland | 99.8 /100 | #22 | Exceptional 83.9% |
| Tlingit-Haida | 99.8 /100 | #23 | Exceptional 83.9% |
| Slovenes | 99.8 /100 | #24 | Exceptional 83.9% |
| Immigrants | North Macedonia | 99.8 /100 | #25 | Exceptional 83.9% |
| Immigrants | Serbia | 99.8 /100 | #26 | Exceptional 83.9% |
| Immigrants | Brazil | 99.8 /100 | #27 | Exceptional 83.9% |
| Immigrants | Lithuania | 99.8 /100 | #28 | Exceptional 83.9% |
| Immigrants | Pakistan | 99.7 /100 | #29 | Exceptional 83.8% |
| Immigrants | Bulgaria | 99.7 /100 | #30 | Exceptional 83.8% |
| Immigrants | Eritrea | 99.7 /100 | #31 | Exceptional 83.8% |
Demographics Similar to Immigrants from Belize by In Labor Force | Age 45-54
In terms of in labor force | age 45-54, the demographic groups most similar to Immigrants from Belize are Iroquois (80.6%, a difference of 0.030%), Osage (80.6%, a difference of 0.050%), Yakama (80.6%, a difference of 0.050%), Mexican American Indian (80.7%, a difference of 0.10%), and Nepalese (80.5%, a difference of 0.12%).
| Demographics | Rating | Rank | In Labor Force | Age 45-54 |
| Belizeans | 0.0 /100 | #284 | Tragic 80.8% |
| Delaware | 0.0 /100 | #285 | Tragic 80.8% |
| Immigrants | Dominica | 0.0 /100 | #286 | Tragic 80.8% |
| Vietnamese | 0.0 /100 | #287 | Tragic 80.8% |
| Cree | 0.0 /100 | #288 | Tragic 80.8% |
| Immigrants | Bangladesh | 0.0 /100 | #289 | Tragic 80.7% |
| Mexican American Indians | 0.0 /100 | #290 | Tragic 80.7% |
| Immigrants | Belize | 0.0 /100 | #291 | Tragic 80.6% |
| Iroquois | 0.0 /100 | #292 | Tragic 80.6% |
| Osage | 0.0 /100 | #293 | Tragic 80.6% |
| Yakama | 0.0 /100 | #294 | Tragic 80.6% |
| Nepalese | 0.0 /100 | #295 | Tragic 80.5% |
| Africans | 0.0 /100 | #296 | Tragic 80.5% |
| Americans | 0.0 /100 | #297 | Tragic 80.4% |
| Marshallese | 0.0 /100 | #298 | Tragic 80.3% |