Slovak vs Delaware In Labor Force | Age > 16
COMPARE
Slovak
Delaware
In Labor Force | Age > 16
In Labor Force | Age > 16 Comparison
Slovaks
Delaware
63.9%
IN LABOR FORCE | AGE > 16
0.1/ 100
METRIC RATING
285th/ 347
METRIC RANK
63.6%
IN LABOR FORCE | AGE > 16
0.0/ 100
METRIC RATING
302nd/ 347
METRIC RANK
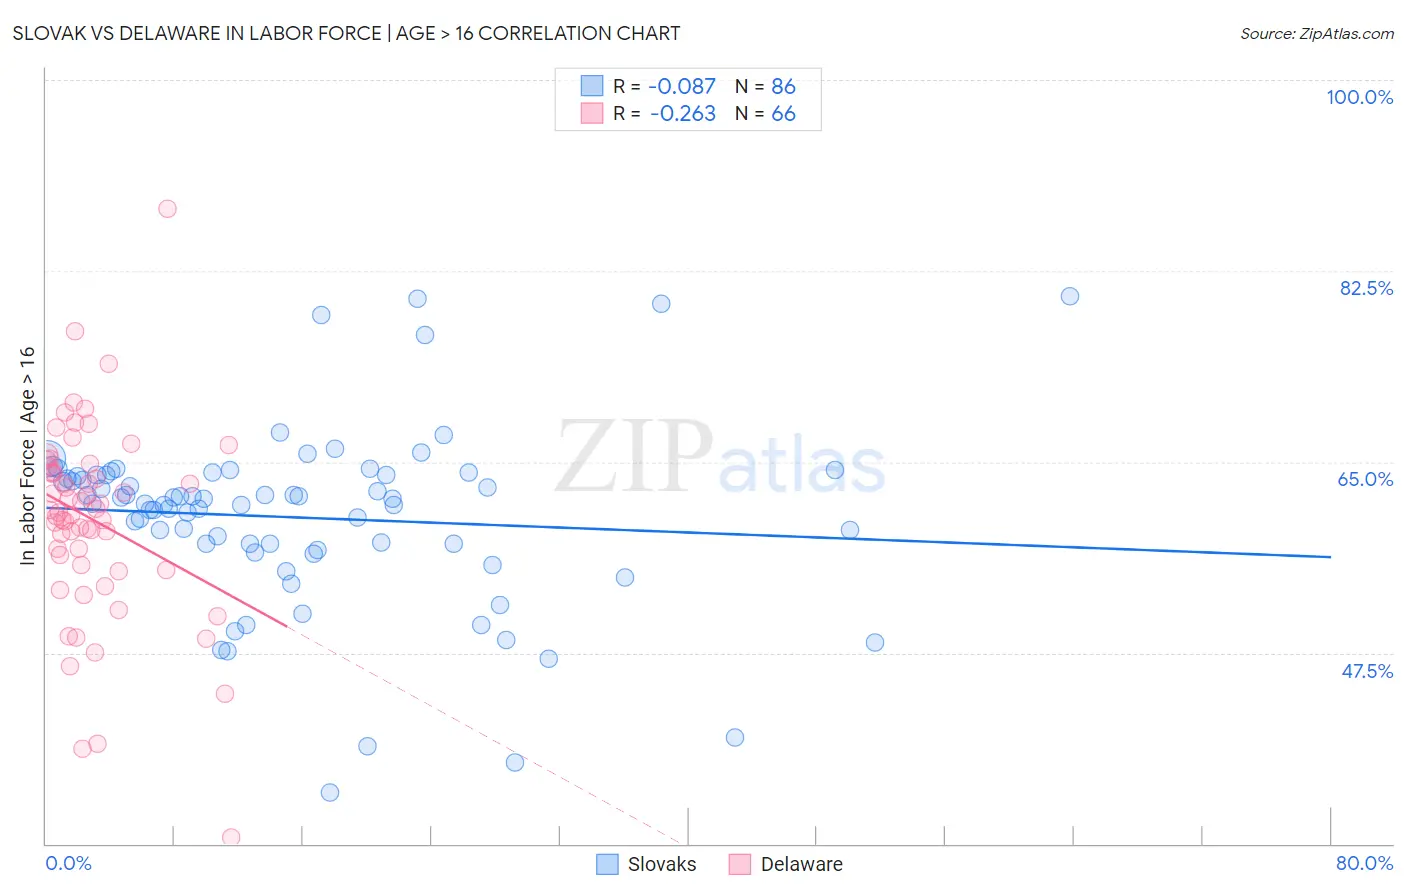
Slovak vs Delaware In Labor Force | Age > 16 Correlation Chart
The statistical analysis conducted on geographies consisting of 397,893,626 people shows a slight negative correlation between the proportion of Slovaks and labor force participation rate among population ages 16 and over in the United States with a correlation coefficient (R) of -0.087 and weighted average of 63.9%. Similarly, the statistical analysis conducted on geographies consisting of 96,240,371 people shows a weak negative correlation between the proportion of Delaware and labor force participation rate among population ages 16 and over in the United States with a correlation coefficient (R) of -0.263 and weighted average of 63.6%, a difference of 0.53%.
In Labor Force | Age > 16 Correlation Summary
| Measurement | Slovak | Delaware |
| Minimum | 34.7% | 30.6% |
| Maximum | 80.2% | 88.2% |
| Range | 45.5% | 57.6% |
| Mean | 59.9% | 59.7% |
| Median | 61.4% | 60.5% |
| Interquartile 25% (IQ1) | 57.4% | 55.6% |
| Interquartile 75% (IQ3) | 63.8% | 64.6% |
| Interquartile Range (IQR) | 6.4% | 9.0% |
| Standard Deviation (Sample) | 8.2% | 9.0% |
| Standard Deviation (Population) | 8.2% | 9.0% |
Demographics Similar to Slovaks and Delaware by In Labor Force | Age > 16
In terms of in labor force | age > 16, the demographic groups most similar to Slovaks are French (63.9%, a difference of 0.030%), Immigrants from Austria (63.9%, a difference of 0.030%), Scottish (63.9%, a difference of 0.030%), Immigrants from Germany (63.9%, a difference of 0.040%), and Spanish (63.9%, a difference of 0.070%). Similarly, the demographic groups most similar to Delaware are Spanish American (63.6%, a difference of 0.010%), Immigrants from the Azores (63.6%, a difference of 0.040%), Cree (63.5%, a difference of 0.040%), White/Caucasian (63.6%, a difference of 0.050%), and Comanche (63.6%, a difference of 0.10%).
| Demographics | Rating | Rank | In Labor Force | Age > 16 |
| Immigrants | Germany | 0.1 /100 | #283 | Tragic 63.9% |
| French | 0.1 /100 | #284 | Tragic 63.9% |
| Slovaks | 0.1 /100 | #285 | Tragic 63.9% |
| Immigrants | Austria | 0.1 /100 | #286 | Tragic 63.9% |
| Scottish | 0.1 /100 | #287 | Tragic 63.9% |
| Spanish | 0.1 /100 | #288 | Tragic 63.9% |
| Celtics | 0.1 /100 | #289 | Tragic 63.8% |
| Hungarians | 0.1 /100 | #290 | Tragic 63.8% |
| Nepalese | 0.1 /100 | #291 | Tragic 63.8% |
| Spanish American Indians | 0.1 /100 | #292 | Tragic 63.8% |
| English | 0.1 /100 | #293 | Tragic 63.7% |
| Puget Sound Salish | 0.0 /100 | #294 | Tragic 63.7% |
| Immigrants | Canada | 0.0 /100 | #295 | Tragic 63.7% |
| Immigrants | North America | 0.0 /100 | #296 | Tragic 63.7% |
| Immigrants | Grenada | 0.0 /100 | #297 | Tragic 63.6% |
| Comanche | 0.0 /100 | #298 | Tragic 63.6% |
| Whites/Caucasians | 0.0 /100 | #299 | Tragic 63.6% |
| Immigrants | Azores | 0.0 /100 | #300 | Tragic 63.6% |
| Spanish Americans | 0.0 /100 | #301 | Tragic 63.6% |
| Delaware | 0.0 /100 | #302 | Tragic 63.6% |
| Cree | 0.0 /100 | #303 | Tragic 63.5% |