Serbian vs Ugandan In Labor Force | Age > 16
COMPARE
Serbian
Ugandan
In Labor Force | Age > 16
In Labor Force | Age > 16 Comparison
Serbians
Ugandans
65.2%
IN LABOR FORCE | AGE > 16
63.5/ 100
METRIC RATING
168th/ 347
METRIC RANK
67.4%
IN LABOR FORCE | AGE > 16
100.0/ 100
METRIC RATING
24th/ 347
METRIC RANK
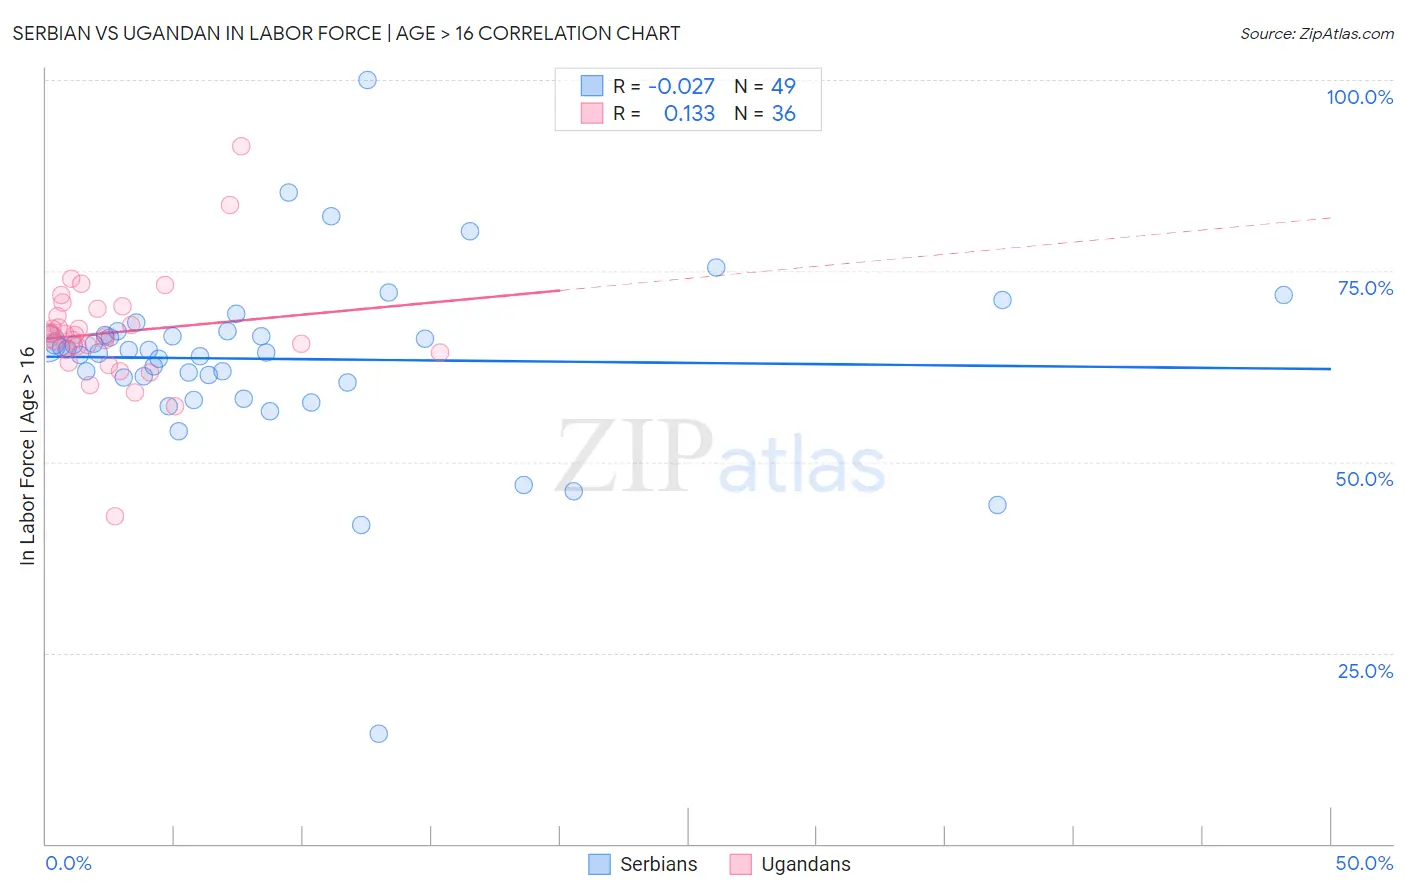
Serbian vs Ugandan In Labor Force | Age > 16 Correlation Chart
The statistical analysis conducted on geographies consisting of 267,655,125 people shows no correlation between the proportion of Serbians and labor force participation rate among population ages 16 and over in the United States with a correlation coefficient (R) of -0.027 and weighted average of 65.2%. Similarly, the statistical analysis conducted on geographies consisting of 94,018,069 people shows a poor positive correlation between the proportion of Ugandans and labor force participation rate among population ages 16 and over in the United States with a correlation coefficient (R) of 0.133 and weighted average of 67.4%, a difference of 3.3%.
In Labor Force | Age > 16 Correlation Summary
| Measurement | Serbian | Ugandan |
| Minimum | 14.4% | 42.9% |
| Maximum | 100.0% | 91.4% |
| Range | 85.6% | 48.5% |
| Mean | 63.5% | 66.9% |
| Median | 64.7% | 66.5% |
| Interquartile 25% (IQ1) | 60.8% | 64.5% |
| Interquartile 75% (IQ3) | 66.8% | 69.6% |
| Interquartile Range (IQR) | 6.1% | 5.1% |
| Standard Deviation (Sample) | 12.1% | 7.5% |
| Standard Deviation (Population) | 12.0% | 7.4% |
Similar Demographics by In Labor Force | Age > 16
Demographics Similar to Serbians by In Labor Force | Age > 16
In terms of in labor force | age > 16, the demographic groups most similar to Serbians are Arab (65.2%, a difference of 0.010%), Immigrants from Israel (65.2%, a difference of 0.020%), Israeli (65.2%, a difference of 0.020%), Immigrants from Belarus (65.2%, a difference of 0.030%), and Immigrants from Sweden (65.2%, a difference of 0.030%).
| Demographics | Rating | Rank | In Labor Force | Age > 16 |
| Australians | 71.3 /100 | #161 | Good 65.3% |
| Albanians | 70.8 /100 | #162 | Good 65.3% |
| South Africans | 69.8 /100 | #163 | Good 65.3% |
| Danes | 68.8 /100 | #164 | Good 65.3% |
| Immigrants | Kazakhstan | 68.1 /100 | #165 | Good 65.3% |
| Immigrants | Western Asia | 67.3 /100 | #166 | Good 65.3% |
| Immigrants | Belarus | 66.0 /100 | #167 | Good 65.2% |
| Serbians | 63.5 /100 | #168 | Good 65.2% |
| Arabs | 62.4 /100 | #169 | Good 65.2% |
| Immigrants | Israel | 61.7 /100 | #170 | Good 65.2% |
| Israelis | 61.6 /100 | #171 | Good 65.2% |
| Immigrants | Sweden | 61.3 /100 | #172 | Good 65.2% |
| Immigrants | Ukraine | 53.7 /100 | #173 | Average 65.1% |
| Macedonians | 50.0 /100 | #174 | Average 65.1% |
| Nicaraguans | 49.7 /100 | #175 | Average 65.1% |
Demographics Similar to Ugandans by In Labor Force | Age > 16
In terms of in labor force | age > 16, the demographic groups most similar to Ugandans are Immigrants from Africa (67.4%, a difference of 0.030%), Immigrants from Cabo Verde (67.3%, a difference of 0.050%), Cambodian (67.4%, a difference of 0.060%), Zimbabwean (67.3%, a difference of 0.13%), and Immigrants from Uganda (67.5%, a difference of 0.18%).
| Demographics | Rating | Rank | In Labor Force | Age > 16 |
| Immigrants | India | 100.0 /100 | #17 | Exceptional 67.6% |
| Immigrants | Liberia | 100.0 /100 | #18 | Exceptional 67.6% |
| Kenyans | 100.0 /100 | #19 | Exceptional 67.6% |
| Immigrants | Kenya | 100.0 /100 | #20 | Exceptional 67.6% |
| Tongans | 100.0 /100 | #21 | Exceptional 67.5% |
| Immigrants | Uganda | 100.0 /100 | #22 | Exceptional 67.5% |
| Cambodians | 100.0 /100 | #23 | Exceptional 67.4% |
| Ugandans | 100.0 /100 | #24 | Exceptional 67.4% |
| Immigrants | Africa | 100.0 /100 | #25 | Exceptional 67.4% |
| Immigrants | Cabo Verde | 100.0 /100 | #26 | Exceptional 67.3% |
| Zimbabweans | 100.0 /100 | #27 | Exceptional 67.3% |
| Immigrants | Morocco | 100.0 /100 | #28 | Exceptional 67.2% |
| Thais | 100.0 /100 | #29 | Exceptional 67.2% |
| Immigrants | Zaire | 100.0 /100 | #30 | Exceptional 67.2% |
| Ghanaians | 100.0 /100 | #31 | Exceptional 67.1% |