Seminole vs Immigrants from Cameroon In Labor Force | Age 20-64
COMPARE
Seminole
Immigrants from Cameroon
In Labor Force | Age 20-64
In Labor Force | Age 20-64 Comparison
Seminole
Immigrants from Cameroon
75.5%
IN LABOR FORCE | AGE 20-64
0.0/ 100
METRIC RATING
321st/ 347
METRIC RANK
81.6%
IN LABOR FORCE | AGE 20-64
100.0/ 100
METRIC RATING
7th/ 347
METRIC RANK
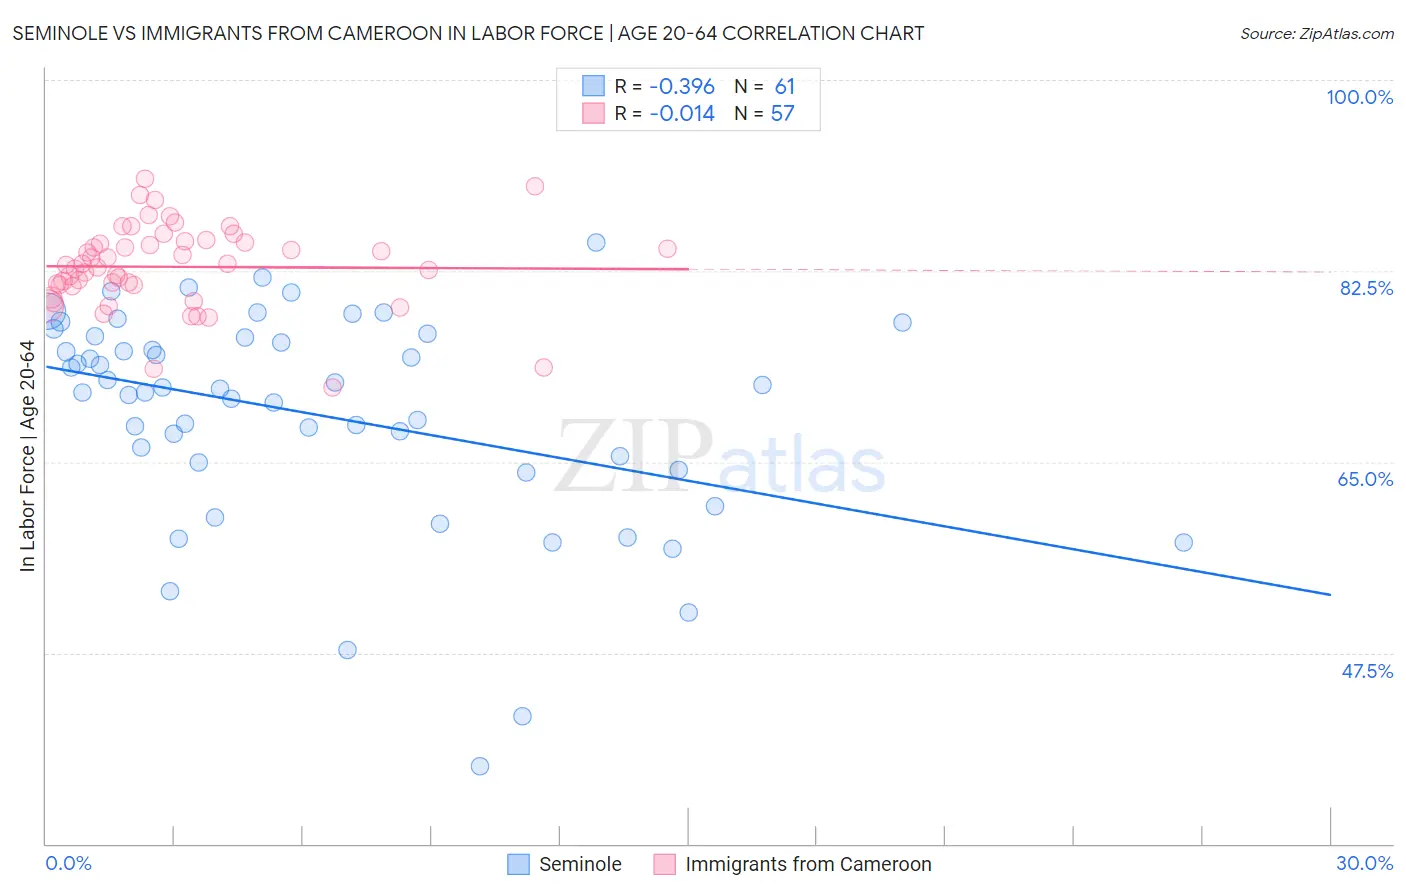
Seminole vs Immigrants from Cameroon In Labor Force | Age 20-64 Correlation Chart
The statistical analysis conducted on geographies consisting of 118,311,145 people shows a mild negative correlation between the proportion of Seminole and labor force participation rate among population between the ages 20 and 64 in the United States with a correlation coefficient (R) of -0.396 and weighted average of 75.5%. Similarly, the statistical analysis conducted on geographies consisting of 130,760,472 people shows no correlation between the proportion of Immigrants from Cameroon and labor force participation rate among population between the ages 20 and 64 in the United States with a correlation coefficient (R) of -0.014 and weighted average of 81.6%, a difference of 8.0%.
In Labor Force | Age 20-64 Correlation Summary
| Measurement | Seminole | Immigrants from Cameroon |
| Minimum | 37.1% | 71.8% |
| Maximum | 85.1% | 90.9% |
| Range | 48.0% | 19.1% |
| Mean | 69.3% | 82.9% |
| Median | 71.7% | 83.1% |
| Interquartile 25% (IQ1) | 64.5% | 81.2% |
| Interquartile 75% (IQ3) | 76.5% | 85.2% |
| Interquartile Range (IQR) | 11.9% | 4.0% |
| Standard Deviation (Sample) | 9.9% | 3.8% |
| Standard Deviation (Population) | 9.8% | 3.8% |
Similar Demographics by In Labor Force | Age 20-64
Demographics Similar to Seminole by In Labor Force | Age 20-64
In terms of in labor force | age 20-64, the demographic groups most similar to Seminole are Dutch West Indian (75.5%, a difference of 0.050%), Cajun (75.5%, a difference of 0.090%), Choctaw (75.4%, a difference of 0.14%), Menominee (75.3%, a difference of 0.28%), and Yakama (75.8%, a difference of 0.35%).
| Demographics | Rating | Rank | In Labor Force | Age 20-64 |
| Blacks/African Americans | 0.0 /100 | #314 | Tragic 76.8% |
| Ottawa | 0.0 /100 | #315 | Tragic 76.7% |
| Yaqui | 0.0 /100 | #316 | Tragic 76.5% |
| Cherokee | 0.0 /100 | #317 | Tragic 76.2% |
| Chickasaw | 0.0 /100 | #318 | Tragic 76.2% |
| Inupiat | 0.0 /100 | #319 | Tragic 76.1% |
| Yakama | 0.0 /100 | #320 | Tragic 75.8% |
| Seminole | 0.0 /100 | #321 | Tragic 75.5% |
| Dutch West Indians | 0.0 /100 | #322 | Tragic 75.5% |
| Cajuns | 0.0 /100 | #323 | Tragic 75.5% |
| Choctaw | 0.0 /100 | #324 | Tragic 75.4% |
| Menominee | 0.0 /100 | #325 | Tragic 75.3% |
| Creek | 0.0 /100 | #326 | Tragic 75.1% |
| Sioux | 0.0 /100 | #327 | Tragic 75.0% |
| Kiowa | 0.0 /100 | #328 | Tragic 75.0% |
Demographics Similar to Immigrants from Cameroon by In Labor Force | Age 20-64
In terms of in labor force | age 20-64, the demographic groups most similar to Immigrants from Cameroon are Immigrants from Somalia (81.6%, a difference of 0.020%), Sierra Leonean (81.5%, a difference of 0.020%), Somali (81.6%, a difference of 0.040%), Immigrants from Sierra Leone (81.5%, a difference of 0.14%), and Bolivian (81.7%, a difference of 0.15%).
| Demographics | Rating | Rank | In Labor Force | Age 20-64 |
| Immigrants | Ethiopia | 100.0 /100 | #1 | Exceptional 82.1% |
| Ethiopians | 100.0 /100 | #2 | Exceptional 82.0% |
| Immigrants | Bolivia | 100.0 /100 | #3 | Exceptional 81.9% |
| Luxembourgers | 100.0 /100 | #4 | Exceptional 81.9% |
| Bolivians | 100.0 /100 | #5 | Exceptional 81.7% |
| Somalis | 100.0 /100 | #6 | Exceptional 81.6% |
| Immigrants | Cameroon | 100.0 /100 | #7 | Exceptional 81.6% |
| Immigrants | Somalia | 100.0 /100 | #8 | Exceptional 81.6% |
| Sierra Leoneans | 100.0 /100 | #9 | Exceptional 81.5% |
| Immigrants | Sierra Leone | 100.0 /100 | #10 | Exceptional 81.5% |
| Immigrants | Eastern Africa | 100.0 /100 | #11 | Exceptional 81.3% |
| Immigrants | Eritrea | 100.0 /100 | #12 | Exceptional 81.3% |
| Immigrants | India | 100.0 /100 | #13 | Exceptional 81.3% |
| Cambodians | 100.0 /100 | #14 | Exceptional 81.1% |
| Bulgarians | 100.0 /100 | #15 | Exceptional 81.1% |