Russian vs Immigrants from Scotland In Labor Force | Age 35-44
COMPARE
Russian
Immigrants from Scotland
In Labor Force | Age 35-44
In Labor Force | Age 35-44 Comparison
Russians
Immigrants from Scotland
85.0%
IN LABOR FORCE | AGE 35-44
99.0/ 100
METRIC RATING
71st/ 347
METRIC RANK
84.7%
IN LABOR FORCE | AGE 35-44
89.6/ 100
METRIC RATING
131st/ 347
METRIC RANK
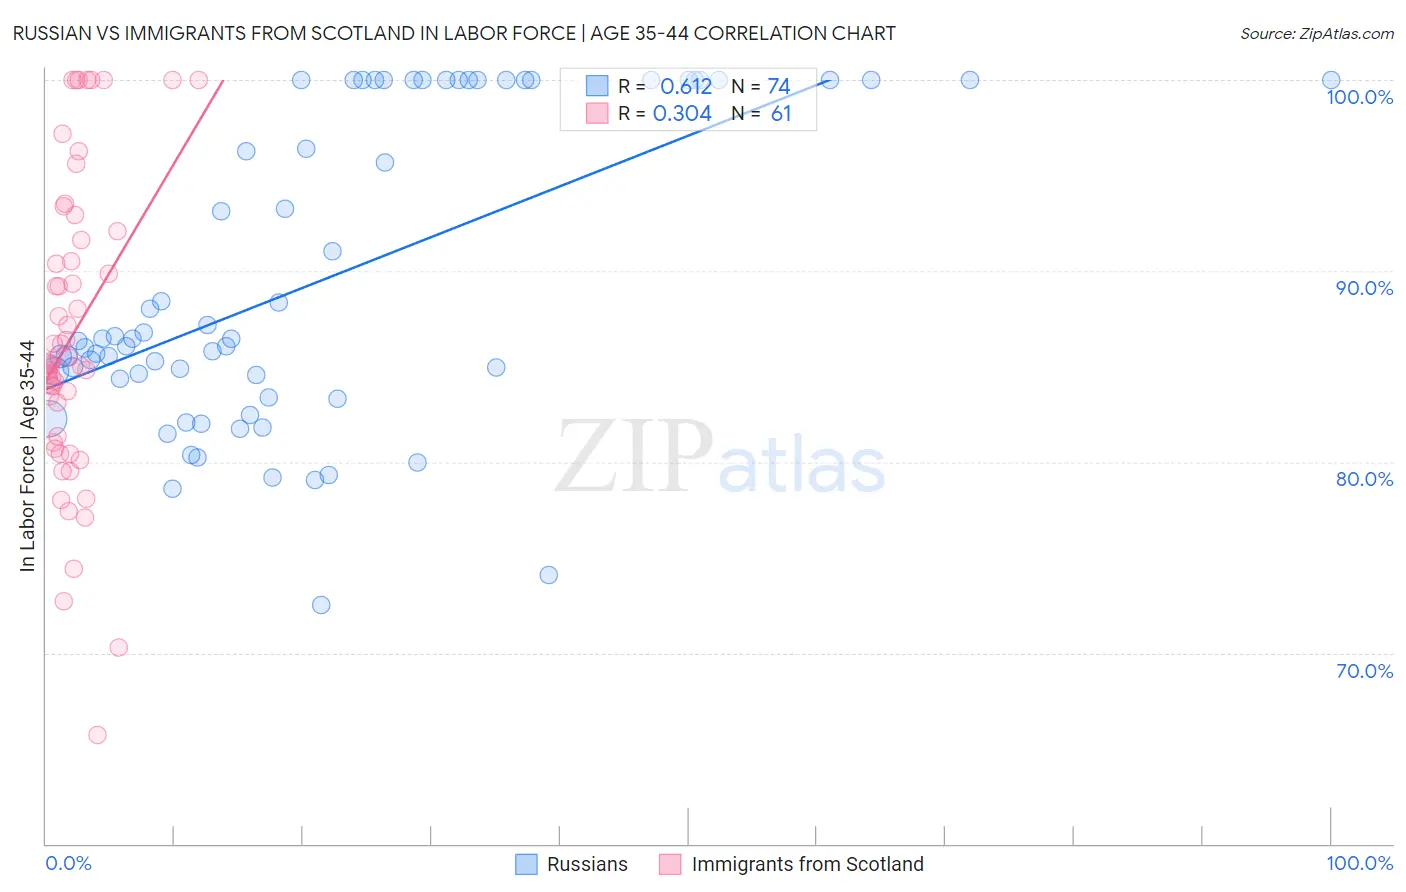
Russian vs Immigrants from Scotland In Labor Force | Age 35-44 Correlation Chart
The statistical analysis conducted on geographies consisting of 511,787,854 people shows a significant positive correlation between the proportion of Russians and labor force participation rate among population between the ages 35 and 44 in the United States with a correlation coefficient (R) of 0.612 and weighted average of 85.0%. Similarly, the statistical analysis conducted on geographies consisting of 196,377,441 people shows a mild positive correlation between the proportion of Immigrants from Scotland and labor force participation rate among population between the ages 35 and 44 in the United States with a correlation coefficient (R) of 0.304 and weighted average of 84.7%, a difference of 0.39%.
In Labor Force | Age 35-44 Correlation Summary
| Measurement | Russian | Immigrants from Scotland |
| Minimum | 72.5% | 65.7% |
| Maximum | 100.0% | 100.0% |
| Range | 27.5% | 34.3% |
| Mean | 89.6% | 86.7% |
| Median | 86.5% | 85.1% |
| Interquartile 25% (IQ1) | 84.4% | 81.2% |
| Interquartile 75% (IQ3) | 100.0% | 91.9% |
| Interquartile Range (IQR) | 15.6% | 10.7% |
| Standard Deviation (Sample) | 8.1% | 7.9% |
| Standard Deviation (Population) | 8.0% | 7.8% |
Similar Demographics by In Labor Force | Age 35-44
Demographics Similar to Russians by In Labor Force | Age 35-44
In terms of in labor force | age 35-44, the demographic groups most similar to Russians are Brazilian (85.0%, a difference of 0.0%), Sudanese (85.0%, a difference of 0.010%), Immigrants from Italy (85.0%, a difference of 0.020%), Italian (85.0%, a difference of 0.020%), and Immigrants from Singapore (85.0%, a difference of 0.020%).
| Demographics | Rating | Rank | In Labor Force | Age 35-44 |
| Swedes | 99.2 /100 | #64 | Exceptional 85.0% |
| Immigrants | Brazil | 99.2 /100 | #65 | Exceptional 85.0% |
| Immigrants | Haiti | 99.1 /100 | #66 | Exceptional 85.0% |
| Immigrants | Italy | 99.1 /100 | #67 | Exceptional 85.0% |
| Italians | 99.1 /100 | #68 | Exceptional 85.0% |
| Sudanese | 99.0 /100 | #69 | Exceptional 85.0% |
| Brazilians | 99.0 /100 | #70 | Exceptional 85.0% |
| Russians | 99.0 /100 | #71 | Exceptional 85.0% |
| Immigrants | Singapore | 98.9 /100 | #72 | Exceptional 85.0% |
| Immigrants | Sri Lanka | 98.9 /100 | #73 | Exceptional 85.0% |
| Colombians | 98.8 /100 | #74 | Exceptional 85.0% |
| Immigrants | South Central Asia | 98.7 /100 | #75 | Exceptional 85.0% |
| Immigrants | Cuba | 98.6 /100 | #76 | Exceptional 84.9% |
| Immigrants | Turkey | 98.6 /100 | #77 | Exceptional 84.9% |
| Immigrants | Africa | 98.4 /100 | #78 | Exceptional 84.9% |
Demographics Similar to Immigrants from Scotland by In Labor Force | Age 35-44
In terms of in labor force | age 35-44, the demographic groups most similar to Immigrants from Scotland are Palestinian (84.7%, a difference of 0.0%), Bhutanese (84.7%, a difference of 0.0%), Austrian (84.7%, a difference of 0.0%), Immigrants from Ghana (84.7%, a difference of 0.010%), and Slavic (84.7%, a difference of 0.020%).
| Demographics | Rating | Rank | In Labor Force | Age 35-44 |
| Slavs | 90.8 /100 | #124 | Exceptional 84.7% |
| Maltese | 90.8 /100 | #125 | Exceptional 84.7% |
| Asians | 90.6 /100 | #126 | Exceptional 84.7% |
| Immigrants | Spain | 90.6 /100 | #127 | Exceptional 84.7% |
| Immigrants | Ghana | 90.4 /100 | #128 | Exceptional 84.7% |
| Palestinians | 89.7 /100 | #129 | Excellent 84.7% |
| Bhutanese | 89.7 /100 | #130 | Excellent 84.7% |
| Immigrants | Scotland | 89.6 /100 | #131 | Excellent 84.7% |
| Austrians | 89.4 /100 | #132 | Excellent 84.7% |
| Argentineans | 88.4 /100 | #133 | Excellent 84.6% |
| Immigrants | Korea | 88.2 /100 | #134 | Excellent 84.6% |
| Immigrants | Malaysia | 87.5 /100 | #135 | Excellent 84.6% |
| Afghans | 86.3 /100 | #136 | Excellent 84.6% |
| Immigrants | Chile | 84.6 /100 | #137 | Excellent 84.6% |
| Czechoslovakians | 82.6 /100 | #138 | Excellent 84.6% |