Puerto Rican vs Trinidadian and Tobagonian In Labor Force | Age 30-34

COMPARE

Puerto Rican
Race
Ancestry
AfghanAfricanAlaska NativeAlaskan AthabascanAlbanianAleutAlsatianAmericanApacheArabArapahoArgentineanArmenianAssyrian/Chaldean/SyriacAustralianAustrianBahamianBangladeshiBarbadianBasqueBelgianBelizeanBermudanBhutaneseBlackfeetBolivianBrazilianBritishBritish West IndianBulgarianBurmeseCajunCambodianCanadianCape VerdeanCarpatho RusynCelticCentral AmericanCentral American IndianCherokeeCheyenneChickasawChileanChineseChippewaChoctawColombianColvilleComancheCosta RicanCreeCreekCroatianCrowCubanCypriotCzechCzechoslovakianDanishDelawareDominicanDutchDutch West IndianEastern EuropeanEcuadorianEgyptianEnglishEstonianEthiopianEuropeanFijianFilipinoFinnishFrenchFrench American IndianFrench CanadianGermanGerman RussianGhanaianGreekGuamanian/ChamorroGuatemalanGuyaneseHaitianHmongHonduranHopiHoumaHungarianIcelanderIndian (Asian)IndonesianInupiatIranianIraqiIrishIroquoisIsraeliItalianJamaicanJapaneseJordanianKenyanKiowaKoreanLaotianLatvianLebaneseLiberianLithuanianLumbeeLuxembourgerMacedonianMalaysianMalteseMarshalleseMenomineeMexicanMexican American IndianMongolianMoroccanNative HawaiianNavajoNepaleseNew ZealanderNicaraguanNigerianNorthern EuropeanNorwegianOkinawanOsageOttawaPaiutePakistaniPalestinianPanamanianParaguayanPennsylvania GermanPeruvianPimaPolishPortuguesePotawatomiPuebloPuerto RicanPuget Sound SalishRomanianRussianSalvadoranSamoanScandinavianScotch-IrishScottishSeminoleSenegaleseSerbianShoshoneSierra LeoneanSiouxSlavicSlovakSloveneSomaliSouth AfricanSouth AmericanSouth American IndianSoviet UnionSpaniardSpanishSpanish AmericanSpanish American IndianSri LankanSubsaharan AfricanSudaneseSwedishSwissSyrianTaiwaneseThaiTlingit-HaidaTohono O'OdhamTonganTsimshianTurkishU.S. Virgin IslanderUgandanUkrainianUruguayanUteVenezuelanVietnameseWelshWest IndianYakamaYaquiYugoslavianYumanYup'ikZimbabwean
Immigration
NonimmigrantsImmigrantsAfghanistanAfricaAlbaniaArgentinaArmeniaAsiaAustraliaAustriaBahamasBangladeshBarbadosBelarusBelgiumBelizeBoliviaBosnia and HerzegovinaBrazilBulgariaBurma/MyanmarCabo VerdeCambodiaCameroonCanadaCaribbeanCentral AmericaChileChinaColombiaCongoCosta RicaCroatiaCubaCzechoslovakiaDenmarkDominicaDominican RepublicEastern AfricaEastern AsiaEastern EuropeEcuadorEgyptEl SalvadorEnglandEritreaEthiopiaEuropeFijiFranceGermanyGhanaGreeceGrenadaGuatemalaGuyanaHaitiHondurasHong KongHungaryIndiaIndonesiaIranIraqIrelandIsraelItalyJamaicaJapanJordanKazakhstanKenyaKoreaKuwaitLaosLatin AmericaLatviaLebanonLiberiaLithuaniaMalaysiaMexicoMicronesiaMiddle AfricaMoldovaMoroccoNepalNetherlandsNicaraguaNigeriaNorth AmericaNorth MacedoniaNorthern AfricaNorthern EuropeNorwayOceaniaPakistanPanamaPeruPhilippinesPolandPortugalRomaniaRussiaSaudi ArabiaScotlandSenegalSerbiaSierra LeoneSingaporeSomaliaSouth AfricaSouth AmericaSouth Central AsiaSouth Eastern AsiaSouthern EuropeSpainSri LankaSt. Vincent and the GrenadinesSudanSwedenSwitzerlandSyriaTaiwanThailandTrinidad and TobagoTurkeyUgandaUkraineUruguayUzbekistanVenezuelaVietnamWest IndiesWestern AfricaWestern AsiaWestern EuropeYemenZaireZimbabweAzores
Trinidadian and Tobagonian
Race
Ancestry
AfghanAfricanAlaska NativeAlaskan AthabascanAlbanianAleutAlsatianAmericanApacheArabArapahoArgentineanArmenianAssyrian/Chaldean/SyriacAustralianAustrianBahamianBangladeshiBarbadianBasqueBelgianBelizeanBermudanBhutaneseBlackfeetBolivianBrazilianBritishBritish West IndianBulgarianBurmeseCajunCambodianCanadianCape VerdeanCarpatho RusynCelticCentral AmericanCentral American IndianCherokeeCheyenneChickasawChileanChineseChippewaChoctawColombianColvilleComancheCosta RicanCreeCreekCroatianCrowCubanCypriotCzechCzechoslovakianDanishDelawareDominicanDutchDutch West IndianEastern EuropeanEcuadorianEgyptianEnglishEstonianEthiopianEuropeanFijianFilipinoFinnishFrenchFrench American IndianFrench CanadianGermanGerman RussianGhanaianGreekGuamanian/ChamorroGuatemalanGuyaneseHaitianHmongHonduranHopiHoumaHungarianIcelanderIndian (Asian)IndonesianInupiatIranianIraqiIrishIroquoisIsraeliItalianJamaicanJapaneseJordanianKenyanKiowaKoreanLaotianLatvianLebaneseLiberianLithuanianLumbeeLuxembourgerMacedonianMalaysianMalteseMarshalleseMenomineeMexicanMexican American IndianMongolianMoroccanNative HawaiianNavajoNepaleseNew ZealanderNicaraguanNigerianNorthern EuropeanNorwegianOkinawanOsageOttawaPaiutePakistaniPalestinianPanamanianParaguayanPennsylvania GermanPeruvianPimaPolishPortuguesePotawatomiPuebloPuget Sound SalishRomanianRussianSalvadoranSamoanScandinavianScotch-IrishScottishSeminoleSenegaleseSerbianShoshoneSierra LeoneanSiouxSlavicSlovakSloveneSomaliSouth AfricanSouth AmericanSouth American IndianSoviet UnionSpaniardSpanishSpanish AmericanSpanish American IndianSri LankanSubsaharan AfricanSudaneseSwedishSwissSyrianTaiwaneseThaiTlingit-HaidaTohono O'OdhamTonganTrinidadian and TobagonianTsimshianTurkishU.S. Virgin IslanderUgandanUkrainianUruguayanUteVenezuelanVietnameseWelshWest IndianYakamaYaquiYugoslavianYumanYup'ikZimbabwean
Immigration
NonimmigrantsImmigrantsAfghanistanAfricaAlbaniaArgentinaArmeniaAsiaAustraliaAustriaBahamasBangladeshBarbadosBelarusBelgiumBelizeBoliviaBosnia and HerzegovinaBrazilBulgariaBurma/MyanmarCabo VerdeCambodiaCameroonCanadaCaribbeanCentral AmericaChileChinaColombiaCongoCosta RicaCroatiaCubaCzechoslovakiaDenmarkDominicaDominican RepublicEastern AfricaEastern AsiaEastern EuropeEcuadorEgyptEl SalvadorEnglandEritreaEthiopiaEuropeFijiFranceGermanyGhanaGreeceGrenadaGuatemalaGuyanaHaitiHondurasHong KongHungaryIndiaIndonesiaIranIraqIrelandIsraelItalyJamaicaJapanJordanKazakhstanKenyaKoreaKuwaitLaosLatin AmericaLatviaLebanonLiberiaLithuaniaMalaysiaMexicoMicronesiaMiddle AfricaMoldovaMoroccoNepalNetherlandsNicaraguaNigeriaNorth AmericaNorth MacedoniaNorthern AfricaNorthern EuropeNorwayOceaniaPakistanPanamaPeruPhilippinesPolandPortugalRomaniaRussiaSaudi ArabiaScotlandSenegalSerbiaSierra LeoneSingaporeSomaliaSouth AfricaSouth AmericaSouth Central AsiaSouth Eastern AsiaSouthern EuropeSpainSri LankaSt. Vincent and the GrenadinesSudanSwedenSwitzerlandSyriaTaiwanThailandTrinidad and TobagoTurkeyUgandaUkraineUruguayUzbekistanVenezuelaVietnamWest IndiesWestern AfricaWestern AsiaWestern EuropeYemenZaireZimbabweAzores
In Labor Force | Age 30-34
Income
Poverty
Unemployment
Labor Participation
Family Structure
Vehicle Availability
Education Level
Disability

In Labor Force | Age 30-34 Comparison

Puerto Ricans

Trinidadians and Tobagonians

Tragic
Poor
81.2%
IN LABOR FORCE | AGE 30-34
0.0/ 100
METRIC RATING
322nd/ 347
METRIC RANK
84.5%
IN LABOR FORCE | AGE 30-34
18.2/ 100
METRIC RATING
201st/ 347
METRIC RANK

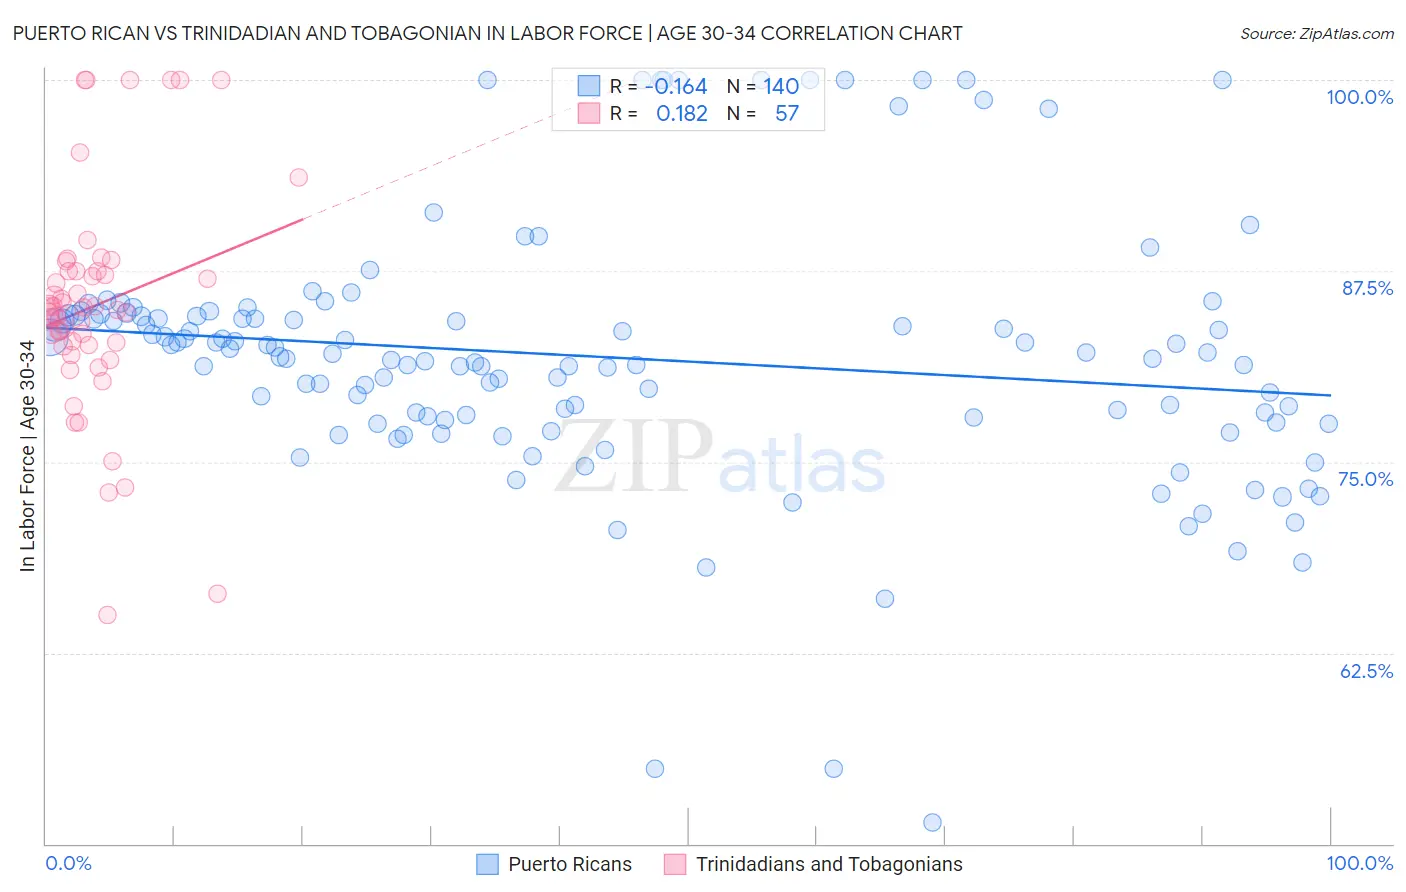
Puerto Rican vs Trinidadian and Tobagonian In Labor Force | Age 30-34 Correlation Chart

The statistical analysis conducted on geographies consisting of 527,590,157 people shows a poor negative correlation between the proportion of Puerto Ricans and labor force participation rate among population between the ages 30 and 34 in the United States with a correlation coefficient (R) of -0.164 and weighted average of 81.2%. Similarly, the statistical analysis conducted on geographies consisting of 219,758,716 people shows a poor positive correlation between the proportion of Trinidadians and Tobagonians and labor force participation rate among population between the ages 30 and 34 in the United States with a correlation coefficient (R) of 0.182 and weighted average of 84.5%, a difference of 4.0%.
Puerto Rican vs Trinidadian and Tobagonian In Labor Force | Age 30-34

In Labor Force | Age 30-34 Correlation Summary

MeasurementPuerto RicanTrinidadian and Tobagonian
Minimum51.4%65.0%
Maximum100.0%100.0%
Range48.6%35.0%
Mean81.9%85.3%
Median82.0%84.9%
Interquartile 25% (IQ1)77.8%82.6%
Interquartile 75% (IQ3)84.6%87.5%
Interquartile Range (IQR)6.8%4.9%
Standard Deviation (Sample)8.5%7.3%
Standard Deviation (Population)8.4%7.3%

Similar Demographics by In Labor Force | Age 30-34

Demographics Similar to Puerto Ricans by In Labor Force | Age 30-34

In terms of in labor force | age 30-34, the demographic groups most similar to Puerto Ricans are Paiute (81.2%, a difference of 0.050%), Cheyenne (81.1%, a difference of 0.080%), Alaska Native (81.3%, a difference of 0.16%), Dutch West Indian (81.0%, a difference of 0.23%), and Yaqui (81.4%, a difference of 0.24%).
DemographicsRating | RankIn Labor Force | Age 30-34
Cherokee
0.0
/100
|
#315
Tragic
81.6%
Immigrants | Azores
0.0
/100
|
#316
Tragic
81.5%
Arapaho
0.0
/100
|
#317
Tragic
81.5%
Choctaw
0.0
/100
|
#318
Tragic
81.4%
Shoshone
0.0
/100
|
#319
Tragic
81.4%
Yaqui
0.0
/100
|
#320
Tragic
81.4%
Alaska Natives
0.0
/100
|
#321
Tragic
81.3%
Puerto Ricans
0.0
/100
|
#322
Tragic
81.2%
Paiute
0.0
/100
|
#323
Tragic
81.2%
Cheyenne
0.0
/100
|
#324
Tragic
81.1%
Dutch West Indians
0.0
/100
|
#325
Tragic
81.0%
Seminole
0.0
/100
|
#326
Tragic
80.8%
Colville
0.0
/100
|
#327
Tragic
80.7%
Sioux
0.0
/100
|
#328
Tragic
80.4%
Creek
0.0
/100
|
#329
Tragic
80.4%

Demographics Similar to Trinidadians and Tobagonians by In Labor Force | Age 30-34

In terms of in labor force | age 30-34, the demographic groups most similar to Trinidadians and Tobagonians are Immigrants from West Indies (84.5%, a difference of 0.0%), Immigrants from Thailand (84.5%, a difference of 0.010%), Subsaharan African (84.5%, a difference of 0.010%), Dutch (84.5%, a difference of 0.020%), and Canadian (84.4%, a difference of 0.030%).
DemographicsRating | RankIn Labor Force | Age 30-34
Immigrants | Afghanistan
23.5
/100
|
#194
Fair
84.5%
Koreans
23.2
/100
|
#195
Fair
84.5%
British
22.9
/100
|
#196
Fair
84.5%
Immigrants | Syria
21.9
/100
|
#197
Fair
84.5%
Dutch
20.2
/100
|
#198
Fair
84.5%
Immigrants | Thailand
19.1
/100
|
#199
Poor
84.5%
Sub-Saharan Africans
19.0
/100
|
#200
Poor
84.5%
Trinidadians and Tobagonians
18.2
/100
|
#201
Poor
84.5%
Immigrants | West Indies
18.1
/100
|
#202
Poor
84.5%
Canadians
15.4
/100
|
#203
Poor
84.4%
Ecuadorians
14.2
/100
|
#204
Poor
84.4%
French
13.8
/100
|
#205
Poor
84.4%
Lebanese
10.6
/100
|
#206
Poor
84.4%
Bangladeshis
9.4
/100
|
#207
Tragic
84.3%
Arabs
8.9
/100
|
#208
Tragic
84.3%