Pueblo vs Kenyan In Labor Force | Age 16-19
COMPARE
Pueblo
Kenyan
In Labor Force | Age 16-19
In Labor Force | Age 16-19 Comparison
Pueblo
Kenyans
34.9%
IN LABOR FORCE | AGE 16-19
2.6/ 100
METRIC RATING
243rd/ 347
METRIC RANK
40.1%
IN LABOR FORCE | AGE 16-19
100.0/ 100
METRIC RATING
65th/ 347
METRIC RANK
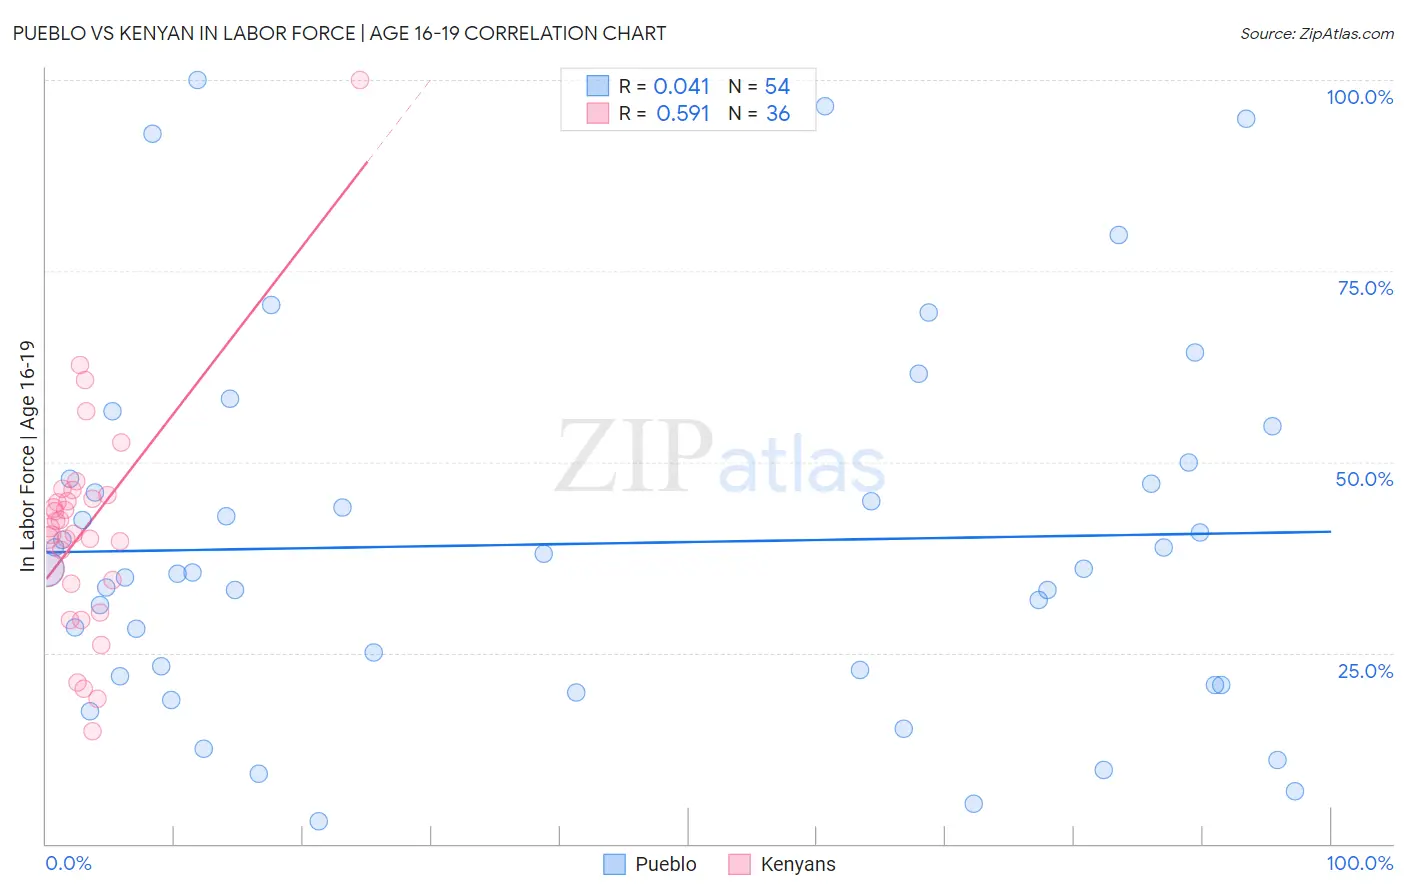
Pueblo vs Kenyan In Labor Force | Age 16-19 Correlation Chart
The statistical analysis conducted on geographies consisting of 119,984,829 people shows no correlation between the proportion of Pueblo and labor force participation rate among population between the ages 16 and 19 in the United States with a correlation coefficient (R) of 0.041 and weighted average of 34.9%. Similarly, the statistical analysis conducted on geographies consisting of 168,228,993 people shows a substantial positive correlation between the proportion of Kenyans and labor force participation rate among population between the ages 16 and 19 in the United States with a correlation coefficient (R) of 0.591 and weighted average of 40.1%, a difference of 15.0%.
In Labor Force | Age 16-19 Correlation Summary
| Measurement | Pueblo | Kenyan |
| Minimum | 3.0% | 14.8% |
| Maximum | 100.0% | 100.0% |
| Range | 97.0% | 85.2% |
| Mean | 39.3% | 41.2% |
| Median | 35.8% | 41.0% |
| Interquartile 25% (IQ1) | 21.9% | 34.3% |
| Interquartile 75% (IQ3) | 47.8% | 45.4% |
| Interquartile Range (IQR) | 25.9% | 11.1% |
| Standard Deviation (Sample) | 23.7% | 14.8% |
| Standard Deviation (Population) | 23.5% | 14.6% |
Similar Demographics by In Labor Force | Age 16-19
Demographics Similar to Pueblo by In Labor Force | Age 16-19
In terms of in labor force | age 16-19, the demographic groups most similar to Pueblo are Immigrants from Turkey (34.9%, a difference of 0.020%), Uruguayan (34.9%, a difference of 0.030%), Immigrants from Greece (34.9%, a difference of 0.080%), Immigrants from Sri Lanka (34.9%, a difference of 0.10%), and Laotian (34.9%, a difference of 0.11%).
| Demographics | Rating | Rank | In Labor Force | Age 16-19 |
| Immigrants | Australia | 3.6 /100 | #236 | Tragic 35.1% |
| Immigrants | India | 3.5 /100 | #237 | Tragic 35.0% |
| Immigrants | Vietnam | 3.4 /100 | #238 | Tragic 35.0% |
| Inupiat | 3.2 /100 | #239 | Tragic 35.0% |
| Immigrants | Central America | 3.0 /100 | #240 | Tragic 35.0% |
| Immigrants | Ireland | 2.9 /100 | #241 | Tragic 35.0% |
| Uruguayans | 2.6 /100 | #242 | Tragic 34.9% |
| Pueblo | 2.6 /100 | #243 | Tragic 34.9% |
| Immigrants | Turkey | 2.6 /100 | #244 | Tragic 34.9% |
| Immigrants | Greece | 2.4 /100 | #245 | Tragic 34.9% |
| Immigrants | Sri Lanka | 2.4 /100 | #246 | Tragic 34.9% |
| Laotians | 2.4 /100 | #247 | Tragic 34.9% |
| Central Americans | 2.2 /100 | #248 | Tragic 34.8% |
| Immigrants | Ukraine | 2.2 /100 | #249 | Tragic 34.8% |
| Immigrants | Pakistan | 2.0 /100 | #250 | Tragic 34.8% |
Demographics Similar to Kenyans by In Labor Force | Age 16-19
In terms of in labor force | age 16-19, the demographic groups most similar to Kenyans are Immigrants from Micronesia (40.2%, a difference of 0.080%), Nonimmigrants (40.1%, a difference of 0.12%), Canadian (40.1%, a difference of 0.13%), Northern European (40.2%, a difference of 0.19%), and Italian (40.1%, a difference of 0.19%).
| Demographics | Rating | Rank | In Labor Force | Age 16-19 |
| Aleuts | 100.0 /100 | #58 | Exceptional 40.4% |
| Slavs | 100.0 /100 | #59 | Exceptional 40.4% |
| Immigrants | Eastern Africa | 100.0 /100 | #60 | Exceptional 40.4% |
| Americans | 100.0 /100 | #61 | Exceptional 40.3% |
| Cherokee | 100.0 /100 | #62 | Exceptional 40.2% |
| Northern Europeans | 100.0 /100 | #63 | Exceptional 40.2% |
| Immigrants | Micronesia | 100.0 /100 | #64 | Exceptional 40.2% |
| Kenyans | 100.0 /100 | #65 | Exceptional 40.1% |
| Immigrants | Nonimmigrants | 100.0 /100 | #66 | Exceptional 40.1% |
| Canadians | 100.0 /100 | #67 | Exceptional 40.1% |
| Italians | 99.9 /100 | #68 | Exceptional 40.1% |
| Potawatomi | 99.9 /100 | #69 | Exceptional 40.0% |
| Portuguese | 99.9 /100 | #70 | Exceptional 40.0% |
| Serbians | 99.9 /100 | #71 | Exceptional 39.9% |
| Iroquois | 99.9 /100 | #72 | Exceptional 39.9% |