Pueblo vs Immigrants from Serbia In Labor Force | Age 30-34

COMPARE

Pueblo
Race
Ancestry
AfghanAfricanAlaska NativeAlaskan AthabascanAlbanianAleutAlsatianAmericanApacheArabArapahoArgentineanArmenianAssyrian/Chaldean/SyriacAustralianAustrianBahamianBangladeshiBarbadianBasqueBelgianBelizeanBermudanBhutaneseBlackfeetBolivianBrazilianBritishBritish West IndianBulgarianBurmeseCajunCambodianCanadianCape VerdeanCarpatho RusynCelticCentral AmericanCentral American IndianCherokeeCheyenneChickasawChileanChineseChippewaChoctawColombianColvilleComancheCosta RicanCreeCreekCroatianCrowCubanCypriotCzechCzechoslovakianDanishDelawareDominicanDutchDutch West IndianEastern EuropeanEcuadorianEgyptianEnglishEstonianEthiopianEuropeanFijianFilipinoFinnishFrenchFrench American IndianFrench CanadianGermanGerman RussianGhanaianGreekGuamanian/ChamorroGuatemalanGuyaneseHaitianHmongHonduranHopiHoumaHungarianIcelanderIndian (Asian)IndonesianInupiatIranianIraqiIrishIroquoisIsraeliItalianJamaicanJapaneseJordanianKenyanKiowaKoreanLaotianLatvianLebaneseLiberianLithuanianLumbeeLuxembourgerMacedonianMalaysianMalteseMarshalleseMenomineeMexicanMexican American IndianMongolianMoroccanNative HawaiianNavajoNepaleseNew ZealanderNicaraguanNigerianNorthern EuropeanNorwegianOkinawanOsageOttawaPaiutePakistaniPalestinianPanamanianParaguayanPennsylvania GermanPeruvianPimaPolishPortuguesePotawatomiPuebloPuerto RicanPuget Sound SalishRomanianRussianSalvadoranSamoanScandinavianScotch-IrishScottishSeminoleSenegaleseSerbianShoshoneSierra LeoneanSiouxSlavicSlovakSloveneSomaliSouth AfricanSouth AmericanSouth American IndianSoviet UnionSpaniardSpanishSpanish AmericanSpanish American IndianSri LankanSubsaharan AfricanSudaneseSwedishSwissSyrianTaiwaneseThaiTlingit-HaidaTohono O'OdhamTonganTrinidadian and TobagonianTsimshianTurkishU.S. Virgin IslanderUgandanUkrainianUruguayanUteVenezuelanVietnameseWelshWest IndianYakamaYaquiYugoslavianYumanYup'ikZimbabwean
Immigration
NonimmigrantsImmigrantsAfghanistanAfricaAlbaniaArgentinaArmeniaAsiaAustraliaAustriaBahamasBangladeshBarbadosBelarusBelgiumBelizeBoliviaBosnia and HerzegovinaBrazilBulgariaBurma/MyanmarCabo VerdeCambodiaCameroonCanadaCaribbeanCentral AmericaChileChinaColombiaCongoCosta RicaCroatiaCubaCzechoslovakiaDenmarkDominicaDominican RepublicEastern AfricaEastern AsiaEastern EuropeEcuadorEgyptEl SalvadorEnglandEritreaEthiopiaEuropeFijiFranceGermanyGhanaGreeceGrenadaGuatemalaGuyanaHaitiHondurasHong KongHungaryIndiaIndonesiaIranIraqIrelandIsraelItalyJamaicaJapanJordanKazakhstanKenyaKoreaKuwaitLaosLatin AmericaLatviaLebanonLiberiaLithuaniaMalaysiaMexicoMicronesiaMiddle AfricaMoldovaMoroccoNepalNetherlandsNicaraguaNigeriaNorth AmericaNorth MacedoniaNorthern AfricaNorthern EuropeNorwayOceaniaPakistanPanamaPeruPhilippinesPolandPortugalRomaniaRussiaSaudi ArabiaScotlandSenegalSierra LeoneSingaporeSomaliaSouth AfricaSouth AmericaSouth Central AsiaSouth Eastern AsiaSouthern EuropeSpainSri LankaSt. Vincent and the GrenadinesSudanSwedenSwitzerlandSyriaTaiwanThailandTrinidad and TobagoTurkeyUgandaUkraineUruguayUzbekistanVenezuelaVietnamWest IndiesWestern AfricaWestern AsiaWestern EuropeYemenZaireZimbabweAzores
Immigrants from Serbia
Race
Ancestry
AfghanAfricanAlaska NativeAlaskan AthabascanAlbanianAleutAlsatianAmericanApacheArabArapahoArgentineanArmenianAssyrian/Chaldean/SyriacAustralianAustrianBahamianBangladeshiBarbadianBasqueBelgianBelizeanBermudanBhutaneseBlackfeetBolivianBrazilianBritishBritish West IndianBulgarianBurmeseCajunCambodianCanadianCape VerdeanCarpatho RusynCelticCentral AmericanCentral American IndianCherokeeCheyenneChickasawChileanChineseChippewaChoctawColombianColvilleComancheCosta RicanCreeCreekCroatianCrowCubanCypriotCzechCzechoslovakianDanishDelawareDominicanDutchDutch West IndianEastern EuropeanEcuadorianEgyptianEnglishEstonianEthiopianEuropeanFijianFilipinoFinnishFrenchFrench American IndianFrench CanadianGermanGerman RussianGhanaianGreekGuamanian/ChamorroGuatemalanGuyaneseHaitianHmongHonduranHopiHoumaHungarianIcelanderIndian (Asian)IndonesianInupiatIranianIraqiIrishIroquoisIsraeliItalianJamaicanJapaneseJordanianKenyanKiowaKoreanLaotianLatvianLebaneseLiberianLithuanianLumbeeLuxembourgerMacedonianMalaysianMalteseMarshalleseMenomineeMexicanMexican American IndianMongolianMoroccanNative HawaiianNavajoNepaleseNew ZealanderNicaraguanNigerianNorthern EuropeanNorwegianOkinawanOsageOttawaPaiutePakistaniPalestinianPanamanianParaguayanPennsylvania GermanPeruvianPimaPolishPortuguesePotawatomiPuerto RicanPuget Sound SalishRomanianRussianSalvadoranSamoanScandinavianScotch-IrishScottishSeminoleSenegaleseSerbianShoshoneSierra LeoneanSiouxSlavicSlovakSloveneSomaliSouth AfricanSouth AmericanSouth American IndianSoviet UnionSpaniardSpanishSpanish AmericanSpanish American IndianSri LankanSubsaharan AfricanSudaneseSwedishSwissSyrianTaiwaneseThaiTlingit-HaidaTohono O'OdhamTonganTrinidadian and TobagonianTsimshianTurkishU.S. Virgin IslanderUgandanUkrainianUruguayanUteVenezuelanVietnameseWelshWest IndianYakamaYaquiYugoslavianYumanYup'ikZimbabwean
Immigration
NonimmigrantsImmigrantsAfghanistanAfricaAlbaniaArgentinaArmeniaAsiaAustraliaAustriaBahamasBangladeshBarbadosBelarusBelgiumBelizeBoliviaBosnia and HerzegovinaBrazilBulgariaBurma/MyanmarCabo VerdeCambodiaCameroonCanadaCaribbeanCentral AmericaChileChinaColombiaCongoCosta RicaCroatiaCubaCzechoslovakiaDenmarkDominicaDominican RepublicEastern AfricaEastern AsiaEastern EuropeEcuadorEgyptEl SalvadorEnglandEritreaEthiopiaEuropeFijiFranceGermanyGhanaGreeceGrenadaGuatemalaGuyanaHaitiHondurasHong KongHungaryIndiaIndonesiaIranIraqIrelandIsraelItalyJamaicaJapanJordanKazakhstanKenyaKoreaKuwaitLaosLatin AmericaLatviaLebanonLiberiaLithuaniaMalaysiaMexicoMicronesiaMiddle AfricaMoldovaMoroccoNepalNetherlandsNicaraguaNigeriaNorth AmericaNorth MacedoniaNorthern AfricaNorthern EuropeNorwayOceaniaPakistanPanamaPeruPhilippinesPolandPortugalRomaniaRussiaSaudi ArabiaScotlandSenegalSerbiaSierra LeoneSingaporeSomaliaSouth AfricaSouth AmericaSouth Central AsiaSouth Eastern AsiaSouthern EuropeSpainSri LankaSt. Vincent and the GrenadinesSudanSwedenSwitzerlandSyriaTaiwanThailandTrinidad and TobagoTurkeyUgandaUkraineUruguayUzbekistanVenezuelaVietnamWest IndiesWestern AfricaWestern AsiaWestern EuropeYemenZaireZimbabweAzores
In Labor Force | Age 30-34
Income
Poverty
Unemployment
Labor Participation
Family Structure
Vehicle Availability
Education Level
Disability

In Labor Force | Age 30-34 Comparison

Pueblo

Immigrants from Serbia

Tragic
Exceptional
80.0%
IN LABOR FORCE | AGE 30-34
0.0/ 100
METRIC RATING
330th/ 347
METRIC RANK
86.2%
IN LABOR FORCE | AGE 30-34
100.0/ 100
METRIC RATING
10th/ 347
METRIC RANK

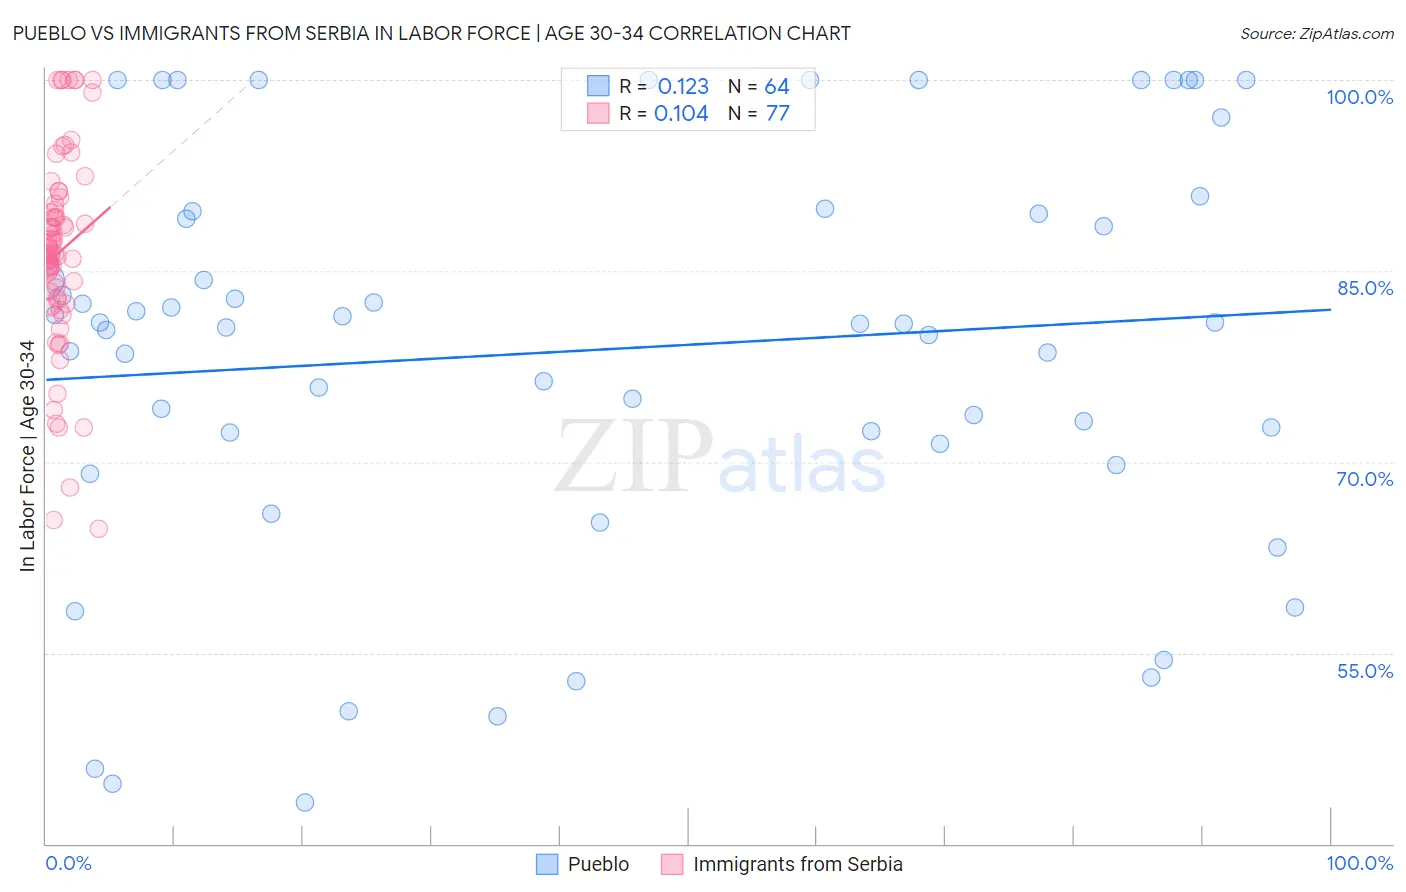
Pueblo vs Immigrants from Serbia In Labor Force | Age 30-34 Correlation Chart

The statistical analysis conducted on geographies consisting of 120,059,209 people shows a poor positive correlation between the proportion of Pueblo and labor force participation rate among population between the ages 30 and 34 in the United States with a correlation coefficient (R) of 0.123 and weighted average of 80.0%. Similarly, the statistical analysis conducted on geographies consisting of 131,692,327 people shows a poor positive correlation between the proportion of Immigrants from Serbia and labor force participation rate among population between the ages 30 and 34 in the United States with a correlation coefficient (R) of 0.104 and weighted average of 86.2%, a difference of 7.7%.
Pueblo vs Immigrants from Serbia In Labor Force | Age 30-34

In Labor Force | Age 30-34 Correlation Summary

MeasurementPuebloImmigrants from Serbia
Minimum43.2%64.7%
Maximum100.0%100.0%
Range56.8%35.3%
Mean78.8%86.5%
Median80.9%86.5%
Interquartile 25% (IQ1)71.9%82.8%
Interquartile 75% (IQ3)89.6%90.0%
Interquartile Range (IQR)17.8%7.2%
Standard Deviation (Sample)15.7%7.7%
Standard Deviation (Population)15.6%7.7%

Similar Demographics by In Labor Force | Age 30-34

Demographics Similar to Pueblo by In Labor Force | Age 30-34

In terms of in labor force | age 30-34, the demographic groups most similar to Pueblo are Houma (79.9%, a difference of 0.17%), Kiowa (79.8%, a difference of 0.28%), Creek (80.4%, a difference of 0.40%), Inupiat (79.7%, a difference of 0.40%), and Sioux (80.4%, a difference of 0.41%).
DemographicsRating | RankIn Labor Force | Age 30-34
Paiute
0.0
/100
|
#323
Tragic
81.2%
Cheyenne
0.0
/100
|
#324
Tragic
81.1%
Dutch West Indians
0.0
/100
|
#325
Tragic
81.0%
Seminole
0.0
/100
|
#326
Tragic
80.8%
Colville
0.0
/100
|
#327
Tragic
80.7%
Sioux
0.0
/100
|
#328
Tragic
80.4%
Creek
0.0
/100
|
#329
Tragic
80.4%
Pueblo
0.0
/100
|
#330
Tragic
80.0%
Houma
0.0
/100
|
#331
Tragic
79.9%
Kiowa
0.0
/100
|
#332
Tragic
79.8%
Inupiat
0.0
/100
|
#333
Tragic
79.7%
Hopi
0.0
/100
|
#334
Tragic
79.3%
Marshallese
0.0
/100
|
#335
Tragic
79.2%
Natives/Alaskans
0.0
/100
|
#336
Tragic
79.2%
Yakama
0.0
/100
|
#337
Tragic
79.1%

Demographics Similar to Immigrants from Serbia by In Labor Force | Age 30-34

In terms of in labor force | age 30-34, the demographic groups most similar to Immigrants from Serbia are Carpatho Rusyn (86.2%, a difference of 0.010%), Immigrants from Somalia (86.2%, a difference of 0.040%), Cambodian (86.2%, a difference of 0.050%), Immigrants from Bolivia (86.2%, a difference of 0.060%), and Somali (86.2%, a difference of 0.070%).
DemographicsRating | RankIn Labor Force | Age 30-34
Immigrants | Ethiopia
100.0
/100
|
#3
Exceptional
86.6%
Liberians
100.0
/100
|
#4
Exceptional
86.4%
Immigrants | Ireland
100.0
/100
|
#5
Exceptional
86.3%
Somalis
100.0
/100
|
#6
Exceptional
86.2%
Immigrants | Bolivia
100.0
/100
|
#7
Exceptional
86.2%
Cambodians
100.0
/100
|
#8
Exceptional
86.2%
Immigrants | Somalia
100.0
/100
|
#9
Exceptional
86.2%
Immigrants | Serbia
100.0
/100
|
#10
Exceptional
86.2%
Carpatho Rusyns
100.0
/100
|
#11
Exceptional
86.2%
Bolivians
100.0
/100
|
#12
Exceptional
86.1%
Immigrants | Croatia
100.0
/100
|
#13
Exceptional
86.1%
Immigrants | Cabo Verde
100.0
/100
|
#14
Exceptional
86.1%
Immigrants | Albania
100.0
/100
|
#15
Exceptional
86.1%
Latvians
100.0
/100
|
#16
Exceptional
86.0%
Immigrants | Cameroon
100.0
/100
|
#17
Exceptional
86.0%