Pima vs Immigrants from North Macedonia In Labor Force | Age 30-34
COMPARE
Pima
Immigrants from North Macedonia
In Labor Force | Age 30-34
In Labor Force | Age 30-34 Comparison
Pima
Immigrants from North Macedonia
79.0%
IN LABOR FORCE | AGE 30-34
0.0/ 100
METRIC RATING
338th/ 347
METRIC RANK
85.9%
IN LABOR FORCE | AGE 30-34
100.0/ 100
METRIC RATING
25th/ 347
METRIC RANK
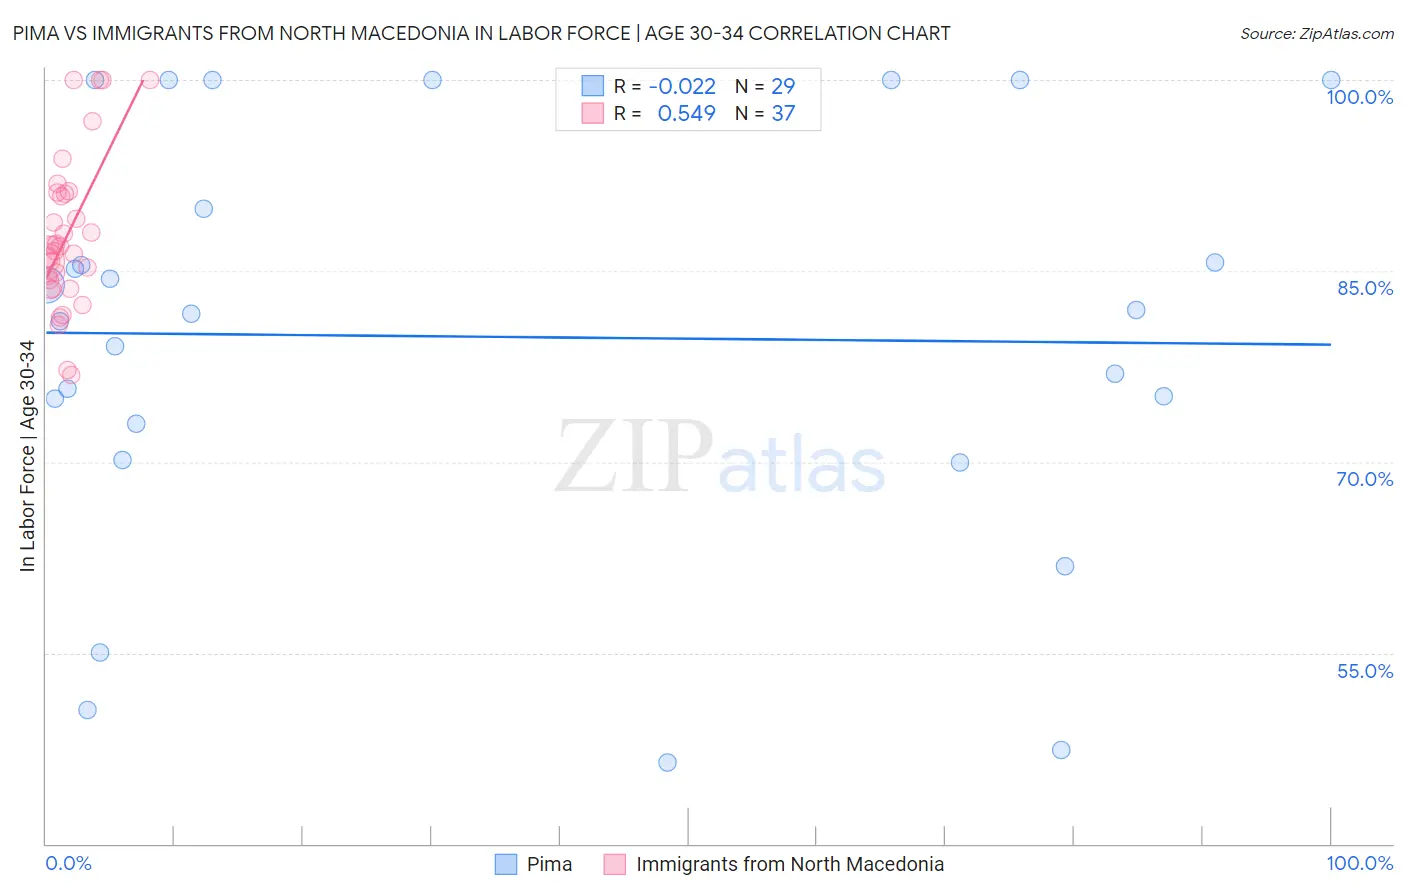
Pima vs Immigrants from North Macedonia In Labor Force | Age 30-34 Correlation Chart
The statistical analysis conducted on geographies consisting of 61,528,436 people shows no correlation between the proportion of Pima and labor force participation rate among population between the ages 30 and 34 in the United States with a correlation coefficient (R) of -0.022 and weighted average of 79.0%. Similarly, the statistical analysis conducted on geographies consisting of 74,312,807 people shows a substantial positive correlation between the proportion of Immigrants from North Macedonia and labor force participation rate among population between the ages 30 and 34 in the United States with a correlation coefficient (R) of 0.549 and weighted average of 85.9%, a difference of 8.7%.
In Labor Force | Age 30-34 Correlation Summary
| Measurement | Pima | Immigrants from North Macedonia |
| Minimum | 46.4% | 76.8% |
| Maximum | 100.0% | 100.0% |
| Range | 53.6% | 23.2% |
| Mean | 79.8% | 87.8% |
| Median | 81.6% | 86.9% |
| Interquartile 25% (IQ1) | 71.6% | 83.9% |
| Interquartile 75% (IQ3) | 95.0% | 91.1% |
| Interquartile Range (IQR) | 23.4% | 7.2% |
| Standard Deviation (Sample) | 16.2% | 6.0% |
| Standard Deviation (Population) | 15.9% | 5.9% |
Similar Demographics by In Labor Force | Age 30-34
Demographics Similar to Pima by In Labor Force | Age 30-34
In terms of in labor force | age 30-34, the demographic groups most similar to Pima are Apache (79.0%, a difference of 0.030%), Yakama (79.1%, a difference of 0.12%), Ute (78.9%, a difference of 0.13%), Native/Alaskan (79.2%, a difference of 0.16%), and Marshallese (79.2%, a difference of 0.24%).
| Demographics | Rating | Rank | In Labor Force | Age 30-34 |
| Houma | 0.0 /100 | #331 | Tragic 79.9% |
| Kiowa | 0.0 /100 | #332 | Tragic 79.8% |
| Inupiat | 0.0 /100 | #333 | Tragic 79.7% |
| Hopi | 0.0 /100 | #334 | Tragic 79.3% |
| Marshallese | 0.0 /100 | #335 | Tragic 79.2% |
| Natives/Alaskans | 0.0 /100 | #336 | Tragic 79.2% |
| Yakama | 0.0 /100 | #337 | Tragic 79.1% |
| Pima | 0.0 /100 | #338 | Tragic 79.0% |
| Apache | 0.0 /100 | #339 | Tragic 79.0% |
| Ute | 0.0 /100 | #340 | Tragic 78.9% |
| Immigrants | Yemen | 0.0 /100 | #341 | Tragic 78.2% |
| Tohono O'odham | 0.0 /100 | #342 | Tragic 77.7% |
| Lumbee | 0.0 /100 | #343 | Tragic 77.3% |
| Yuman | 0.0 /100 | #344 | Tragic 77.1% |
| Yup'ik | 0.0 /100 | #345 | Tragic 76.4% |
Demographics Similar to Immigrants from North Macedonia by In Labor Force | Age 30-34
In terms of in labor force | age 30-34, the demographic groups most similar to Immigrants from North Macedonia are Immigrants from Eritrea (85.9%, a difference of 0.010%), Immigrants from Eastern Africa (85.9%, a difference of 0.010%), Bermudan (85.9%, a difference of 0.020%), Estonian (85.9%, a difference of 0.020%), and Immigrants from Liberia (85.9%, a difference of 0.030%).
| Demographics | Rating | Rank | In Labor Force | Age 30-34 |
| Immigrants | Sierra Leone | 100.0 /100 | #18 | Exceptional 86.0% |
| Sierra Leoneans | 100.0 /100 | #19 | Exceptional 86.0% |
| Bulgarians | 100.0 /100 | #20 | Exceptional 86.0% |
| Immigrants | Bulgaria | 100.0 /100 | #21 | Exceptional 86.0% |
| Bermudans | 100.0 /100 | #22 | Exceptional 85.9% |
| Estonians | 100.0 /100 | #23 | Exceptional 85.9% |
| Immigrants | Eritrea | 100.0 /100 | #24 | Exceptional 85.9% |
| Immigrants | North Macedonia | 100.0 /100 | #25 | Exceptional 85.9% |
| Immigrants | Eastern Africa | 100.0 /100 | #26 | Exceptional 85.9% |
| Immigrants | Liberia | 100.0 /100 | #27 | Exceptional 85.9% |
| Immigrants | Latvia | 100.0 /100 | #28 | Exceptional 85.9% |
| Tsimshian | 100.0 /100 | #29 | Exceptional 85.8% |
| Immigrants | Hong Kong | 100.0 /100 | #30 | Exceptional 85.8% |
| Paraguayans | 99.9 /100 | #31 | Exceptional 85.8% |
| Cypriots | 99.9 /100 | #32 | Exceptional 85.8% |