Peruvian vs Osage In Labor Force | Age 16-19
COMPARE
Peruvian
Osage
In Labor Force | Age 16-19
In Labor Force | Age 16-19 Comparison
Peruvians
Osage
34.6%
IN LABOR FORCE | AGE 16-19
1.4/ 100
METRIC RATING
255th/ 347
METRIC RANK
39.0%
IN LABOR FORCE | AGE 16-19
99.4/ 100
METRIC RATING
92nd/ 347
METRIC RANK
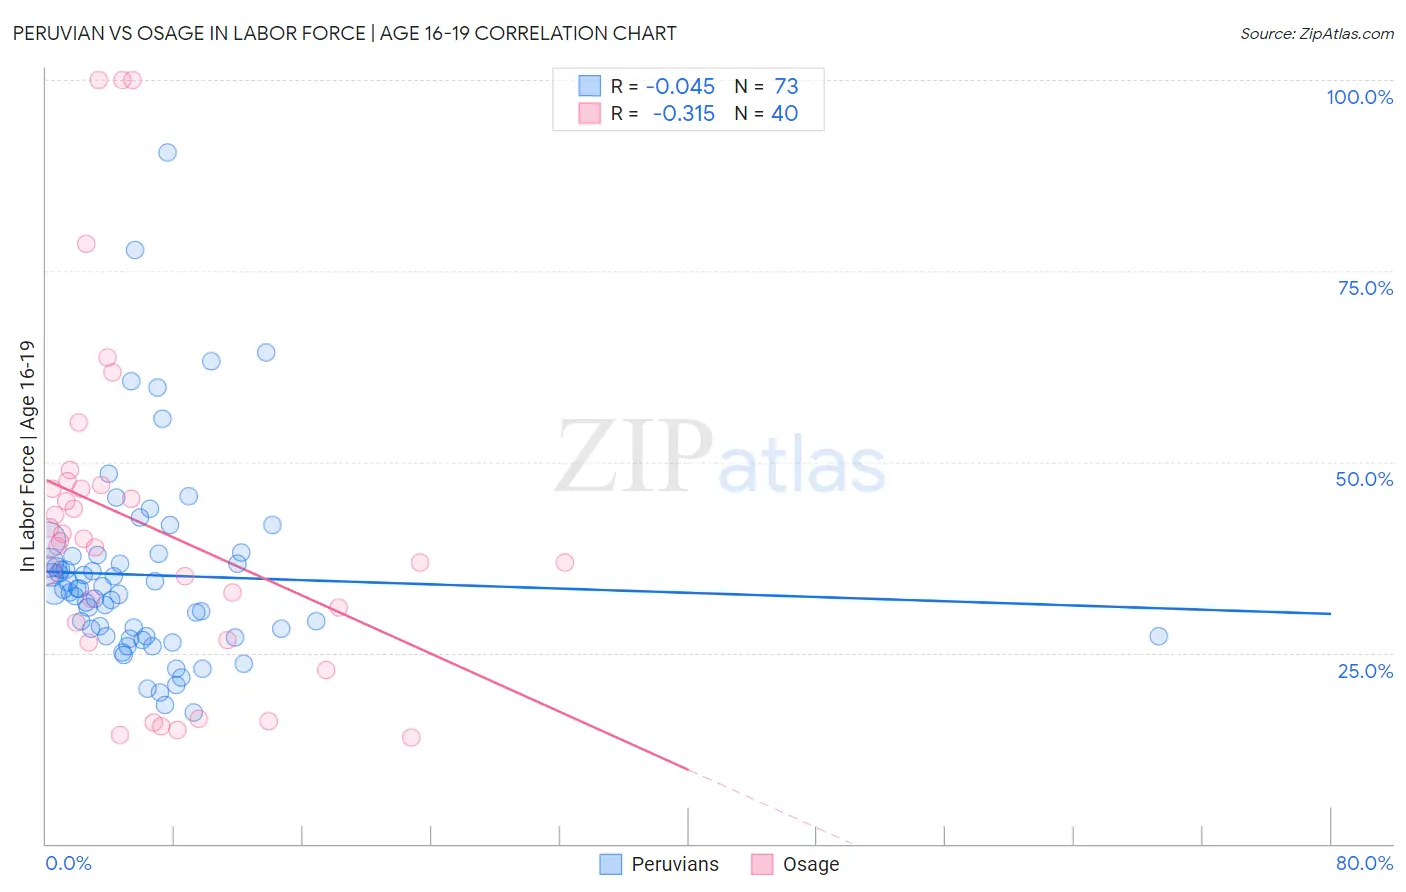
Peruvian vs Osage In Labor Force | Age 16-19 Correlation Chart
The statistical analysis conducted on geographies consisting of 362,835,907 people shows no correlation between the proportion of Peruvians and labor force participation rate among population between the ages 16 and 19 in the United States with a correlation coefficient (R) of -0.045 and weighted average of 34.6%. Similarly, the statistical analysis conducted on geographies consisting of 91,776,050 people shows a mild negative correlation between the proportion of Osage and labor force participation rate among population between the ages 16 and 19 in the United States with a correlation coefficient (R) of -0.315 and weighted average of 39.0%, a difference of 12.6%.
In Labor Force | Age 16-19 Correlation Summary
| Measurement | Peruvian | Osage |
| Minimum | 17.1% | 13.9% |
| Maximum | 90.5% | 100.0% |
| Range | 73.4% | 86.1% |
| Mean | 35.2% | 41.6% |
| Median | 33.0% | 39.3% |
| Interquartile 25% (IQ1) | 27.1% | 27.8% |
| Interquartile 75% (IQ3) | 37.8% | 46.7% |
| Interquartile Range (IQR) | 10.6% | 19.0% |
| Standard Deviation (Sample) | 12.9% | 22.1% |
| Standard Deviation (Population) | 12.8% | 21.9% |
Similar Demographics by In Labor Force | Age 16-19
Demographics Similar to Peruvians by In Labor Force | Age 16-19
In terms of in labor force | age 16-19, the demographic groups most similar to Peruvians are Bahamian (34.6%, a difference of 0.040%), Immigrants from South Central Asia (34.6%, a difference of 0.11%), Immigrants from Egypt (34.6%, a difference of 0.11%), Thai (34.6%, a difference of 0.12%), and Immigrants (34.6%, a difference of 0.13%).
| Demographics | Rating | Rank | In Labor Force | Age 16-19 |
| Central Americans | 2.2 /100 | #248 | Tragic 34.8% |
| Immigrants | Ukraine | 2.2 /100 | #249 | Tragic 34.8% |
| Immigrants | Pakistan | 2.0 /100 | #250 | Tragic 34.8% |
| Immigrants | Western Asia | 2.0 /100 | #251 | Tragic 34.8% |
| Immigrants | Chile | 2.0 /100 | #252 | Tragic 34.8% |
| Immigrants | Japan | 1.5 /100 | #253 | Tragic 34.7% |
| Bahamians | 1.4 /100 | #254 | Tragic 34.6% |
| Peruvians | 1.4 /100 | #255 | Tragic 34.6% |
| Immigrants | South Central Asia | 1.3 /100 | #256 | Tragic 34.6% |
| Immigrants | Egypt | 1.2 /100 | #257 | Tragic 34.6% |
| Thais | 1.2 /100 | #258 | Tragic 34.6% |
| Immigrants | Immigrants | 1.2 /100 | #259 | Tragic 34.6% |
| Egyptians | 1.2 /100 | #260 | Tragic 34.5% |
| Salvadorans | 1.1 /100 | #261 | Tragic 34.5% |
| Hispanics or Latinos | 1.1 /100 | #262 | Tragic 34.5% |
Demographics Similar to Osage by In Labor Force | Age 16-19
In terms of in labor force | age 16-19, the demographic groups most similar to Osage are Blackfeet (38.9%, a difference of 0.060%), Immigrants from Canada (38.9%, a difference of 0.060%), Spanish American (39.0%, a difference of 0.090%), Immigrants from North America (38.9%, a difference of 0.15%), and Latvian (38.9%, a difference of 0.18%).
| Demographics | Rating | Rank | In Labor Force | Age 16-19 |
| Creek | 99.6 /100 | #85 | Exceptional 39.1% |
| Samoans | 99.6 /100 | #86 | Exceptional 39.1% |
| Immigrants | Germany | 99.6 /100 | #87 | Exceptional 39.1% |
| Puget Sound Salish | 99.6 /100 | #88 | Exceptional 39.1% |
| Alaska Natives | 99.6 /100 | #89 | Exceptional 39.1% |
| Immigrants | Burma/Myanmar | 99.5 /100 | #90 | Exceptional 39.0% |
| Spanish Americans | 99.5 /100 | #91 | Exceptional 39.0% |
| Osage | 99.4 /100 | #92 | Exceptional 39.0% |
| Blackfeet | 99.4 /100 | #93 | Exceptional 38.9% |
| Immigrants | Canada | 99.4 /100 | #94 | Exceptional 38.9% |
| Immigrants | North America | 99.4 /100 | #95 | Exceptional 38.9% |
| Latvians | 99.4 /100 | #96 | Exceptional 38.9% |
| Greeks | 99.3 /100 | #97 | Exceptional 38.9% |
| Ugandans | 99.3 /100 | #98 | Exceptional 38.9% |
| Immigrants | North Macedonia | 99.3 /100 | #99 | Exceptional 38.9% |