Pennsylvania German vs White/Caucasian In Labor Force | Age 25-29
COMPARE
Pennsylvania German
White/Caucasian
In Labor Force | Age 25-29
In Labor Force | Age 25-29 Comparison
Pennsylvania Germans
Whites/Caucasians
83.6%
IN LABOR FORCE | AGE 25-29
0.1/ 100
METRIC RATING
261st/ 347
METRIC RANK
84.2%
IN LABOR FORCE | AGE 25-29
4.8/ 100
METRIC RATING
230th/ 347
METRIC RANK
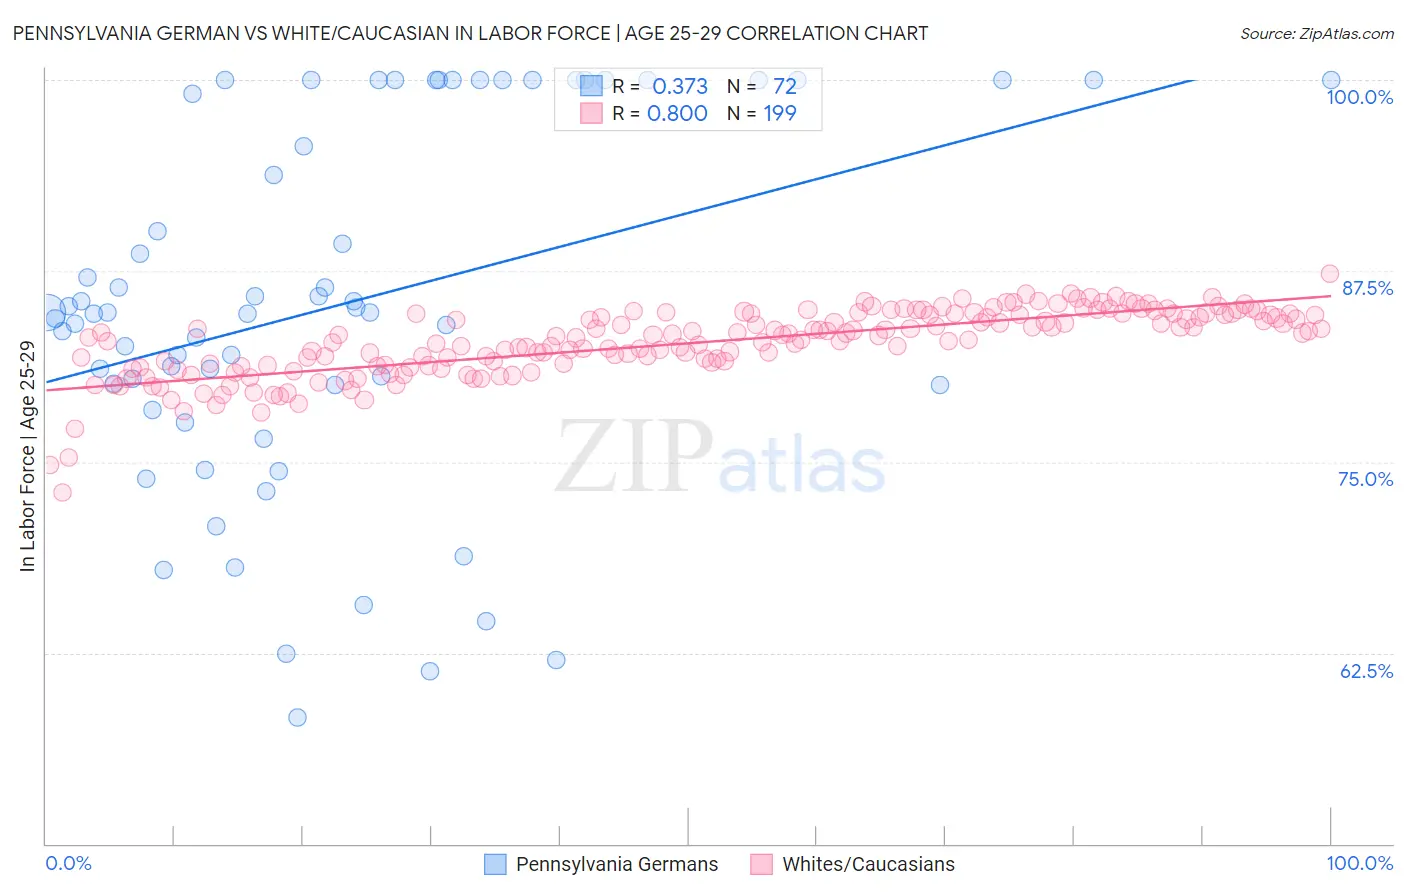
Pennsylvania German vs White/Caucasian In Labor Force | Age 25-29 Correlation Chart
The statistical analysis conducted on geographies consisting of 234,004,044 people shows a mild positive correlation between the proportion of Pennsylvania Germans and labor force participation rate among population between the ages 25 and 29 in the United States with a correlation coefficient (R) of 0.373 and weighted average of 83.6%. Similarly, the statistical analysis conducted on geographies consisting of 582,492,747 people shows a strong positive correlation between the proportion of Whites/Caucasians and labor force participation rate among population between the ages 25 and 29 in the United States with a correlation coefficient (R) of 0.800 and weighted average of 84.2%, a difference of 0.69%.
In Labor Force | Age 25-29 Correlation Summary
| Measurement | Pennsylvania German | White/Caucasian |
| Minimum | 58.3% | 73.0% |
| Maximum | 100.0% | 87.3% |
| Range | 41.7% | 14.3% |
| Mean | 85.3% | 82.8% |
| Median | 84.8% | 83.2% |
| Interquartile 25% (IQ1) | 80.0% | 81.3% |
| Interquartile 75% (IQ3) | 100.0% | 84.6% |
| Interquartile Range (IQR) | 20.0% | 3.3% |
| Standard Deviation (Sample) | 11.7% | 2.2% |
| Standard Deviation (Population) | 11.6% | 2.2% |
Similar Demographics by In Labor Force | Age 25-29
Demographics Similar to Pennsylvania Germans by In Labor Force | Age 25-29
In terms of in labor force | age 25-29, the demographic groups most similar to Pennsylvania Germans are Immigrants from Bahamas (83.6%, a difference of 0.0%), Spanish (83.6%, a difference of 0.010%), Immigrants from Guatemala (83.6%, a difference of 0.020%), Delaware (83.7%, a difference of 0.060%), and Immigrants from Fiji (83.6%, a difference of 0.060%).
| Demographics | Rating | Rank | In Labor Force | Age 25-29 |
| Spaniards | 0.2 /100 | #254 | Tragic 83.7% |
| Haitians | 0.2 /100 | #255 | Tragic 83.7% |
| Immigrants | Haiti | 0.2 /100 | #256 | Tragic 83.7% |
| Delaware | 0.2 /100 | #257 | Tragic 83.7% |
| Immigrants | Guatemala | 0.1 /100 | #258 | Tragic 83.6% |
| Spanish | 0.1 /100 | #259 | Tragic 83.6% |
| Immigrants | Bahamas | 0.1 /100 | #260 | Tragic 83.6% |
| Pennsylvania Germans | 0.1 /100 | #261 | Tragic 83.6% |
| Immigrants | Fiji | 0.1 /100 | #262 | Tragic 83.6% |
| West Indians | 0.1 /100 | #263 | Tragic 83.5% |
| Puget Sound Salish | 0.1 /100 | #264 | Tragic 83.5% |
| Cubans | 0.1 /100 | #265 | Tragic 83.5% |
| Aleuts | 0.0 /100 | #266 | Tragic 83.4% |
| Spanish Americans | 0.0 /100 | #267 | Tragic 83.4% |
| Immigrants | Lebanon | 0.0 /100 | #268 | Tragic 83.4% |
Demographics Similar to Whites/Caucasians by In Labor Force | Age 25-29
In terms of in labor force | age 25-29, the demographic groups most similar to Whites/Caucasians are Immigrants from Oceania (84.2%, a difference of 0.0%), Immigrants from Philippines (84.2%, a difference of 0.010%), Panamanian (84.2%, a difference of 0.010%), French American Indian (84.2%, a difference of 0.020%), and Immigrants from Panama (84.2%, a difference of 0.020%).
| Demographics | Rating | Rank | In Labor Force | Age 25-29 |
| Scotch-Irish | 6.5 /100 | #223 | Tragic 84.2% |
| Immigrants | West Indies | 6.0 /100 | #224 | Tragic 84.2% |
| Koreans | 5.9 /100 | #225 | Tragic 84.2% |
| Immigrants | Congo | 5.8 /100 | #226 | Tragic 84.2% |
| French American Indians | 5.5 /100 | #227 | Tragic 84.2% |
| Immigrants | Panama | 5.5 /100 | #228 | Tragic 84.2% |
| Immigrants | Oceania | 5.0 /100 | #229 | Tragic 84.2% |
| Whites/Caucasians | 4.8 /100 | #230 | Tragic 84.2% |
| Immigrants | Philippines | 4.7 /100 | #231 | Tragic 84.2% |
| Panamanians | 4.5 /100 | #232 | Tragic 84.2% |
| Immigrants | Western Asia | 2.7 /100 | #233 | Tragic 84.1% |
| Barbadians | 1.0 /100 | #234 | Tragic 83.9% |
| Iraqis | 0.9 /100 | #235 | Tragic 83.9% |
| Guamanians/Chamorros | 0.9 /100 | #236 | Tragic 83.9% |
| Immigrants | Immigrants | 0.9 /100 | #237 | Tragic 83.9% |