Pennsylvania German vs Puerto Rican In Labor Force | Age 35-44
COMPARE
Pennsylvania German
Puerto Rican
In Labor Force | Age 35-44
In Labor Force | Age 35-44 Comparison
Pennsylvania Germans
Puerto Ricans
82.9%
IN LABOR FORCE | AGE 35-44
0.0/ 100
METRIC RATING
291st/ 347
METRIC RANK
80.7%
IN LABOR FORCE | AGE 35-44
0.0/ 100
METRIC RATING
321st/ 347
METRIC RANK
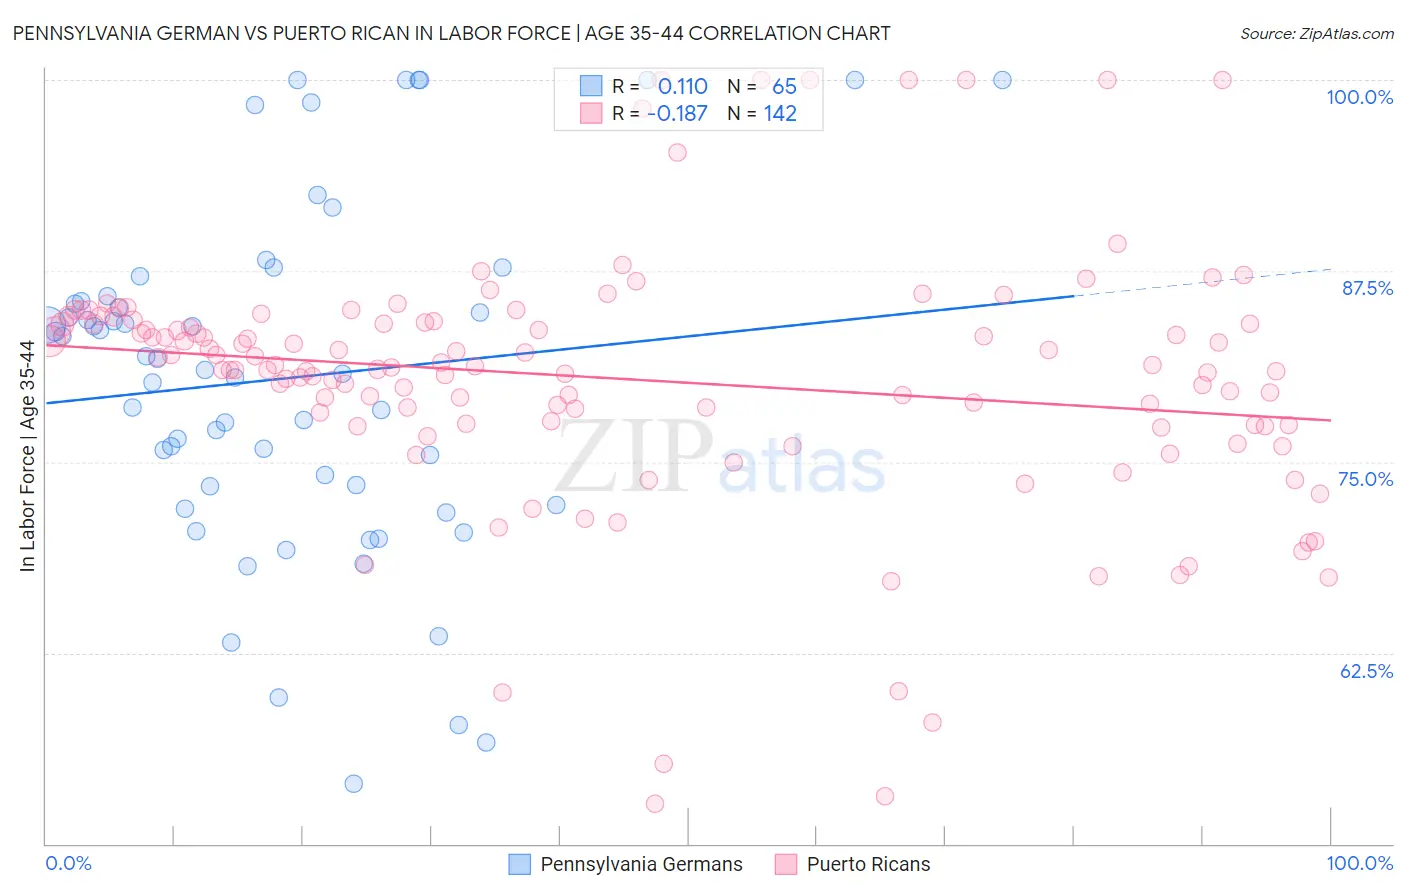
Pennsylvania German vs Puerto Rican In Labor Force | Age 35-44 Correlation Chart
The statistical analysis conducted on geographies consisting of 234,051,901 people shows a poor positive correlation between the proportion of Pennsylvania Germans and labor force participation rate among population between the ages 35 and 44 in the United States with a correlation coefficient (R) of 0.110 and weighted average of 82.9%. Similarly, the statistical analysis conducted on geographies consisting of 527,777,959 people shows a poor negative correlation between the proportion of Puerto Ricans and labor force participation rate among population between the ages 35 and 44 in the United States with a correlation coefficient (R) of -0.187 and weighted average of 80.7%, a difference of 2.7%.
In Labor Force | Age 35-44 Correlation Summary
| Measurement | Pennsylvania German | Puerto Rican |
| Minimum | 53.9% | 52.6% |
| Maximum | 100.0% | 100.0% |
| Range | 46.1% | 47.4% |
| Mean | 80.5% | 80.4% |
| Median | 81.0% | 81.2% |
| Interquartile 25% (IQ1) | 72.8% | 77.5% |
| Interquartile 75% (IQ3) | 85.7% | 84.1% |
| Interquartile Range (IQR) | 12.9% | 6.7% |
| Standard Deviation (Sample) | 11.3% | 8.4% |
| Standard Deviation (Population) | 11.2% | 8.3% |
Similar Demographics by In Labor Force | Age 35-44
Demographics Similar to Pennsylvania Germans by In Labor Force | Age 35-44
In terms of in labor force | age 35-44, the demographic groups most similar to Pennsylvania Germans are African (82.9%, a difference of 0.020%), Chippewa (82.9%, a difference of 0.030%), Puget Sound Salish (82.9%, a difference of 0.040%), Immigrants from Latin America (82.8%, a difference of 0.050%), and Fijian (82.9%, a difference of 0.060%).
| Demographics | Rating | Rank | In Labor Force | Age 35-44 |
| Immigrants | Dominican Republic | 0.0 /100 | #284 | Tragic 82.9% |
| Fijians | 0.0 /100 | #285 | Tragic 82.9% |
| Immigrants | Bangladesh | 0.0 /100 | #286 | Tragic 82.9% |
| Immigrants | Belize | 0.0 /100 | #287 | Tragic 82.9% |
| Puget Sound Salish | 0.0 /100 | #288 | Tragic 82.9% |
| Chippewa | 0.0 /100 | #289 | Tragic 82.9% |
| Africans | 0.0 /100 | #290 | Tragic 82.9% |
| Pennsylvania Germans | 0.0 /100 | #291 | Tragic 82.9% |
| Immigrants | Latin America | 0.0 /100 | #292 | Tragic 82.8% |
| Spanish Americans | 0.0 /100 | #293 | Tragic 82.8% |
| Potawatomi | 0.0 /100 | #294 | Tragic 82.7% |
| Immigrants | Lebanon | 0.0 /100 | #295 | Tragic 82.7% |
| Mexican American Indians | 0.0 /100 | #296 | Tragic 82.6% |
| Hmong | 0.0 /100 | #297 | Tragic 82.6% |
| Ottawa | 0.0 /100 | #298 | Tragic 82.6% |
Demographics Similar to Puerto Ricans by In Labor Force | Age 35-44
In terms of in labor force | age 35-44, the demographic groups most similar to Puerto Ricans are Paiute (80.6%, a difference of 0.070%), Yaqui (80.5%, a difference of 0.18%), Choctaw (80.5%, a difference of 0.19%), Chickasaw (80.9%, a difference of 0.28%), and Inupiat (80.9%, a difference of 0.33%).
| Demographics | Rating | Rank | In Labor Force | Age 35-44 |
| Cajuns | 0.0 /100 | #314 | Tragic 81.5% |
| Immigrants | Mexico | 0.0 /100 | #315 | Tragic 81.5% |
| Comanche | 0.0 /100 | #316 | Tragic 81.5% |
| Cherokee | 0.0 /100 | #317 | Tragic 81.4% |
| Alaskan Athabascans | 0.0 /100 | #318 | Tragic 81.3% |
| Inupiat | 0.0 /100 | #319 | Tragic 80.9% |
| Chickasaw | 0.0 /100 | #320 | Tragic 80.9% |
| Puerto Ricans | 0.0 /100 | #321 | Tragic 80.7% |
| Paiute | 0.0 /100 | #322 | Tragic 80.6% |
| Yaqui | 0.0 /100 | #323 | Tragic 80.5% |
| Choctaw | 0.0 /100 | #324 | Tragic 80.5% |
| Dutch West Indians | 0.0 /100 | #325 | Tragic 80.4% |
| Seminole | 0.0 /100 | #326 | Tragic 80.4% |
| Sioux | 0.0 /100 | #327 | Tragic 80.2% |
| Creek | 0.0 /100 | #328 | Tragic 80.0% |