Paraguayan vs Immigrants from Guyana In Labor Force | Age 20-24
COMPARE
Paraguayan
Immigrants from Guyana
In Labor Force | Age 20-24
In Labor Force | Age 20-24 Comparison
Paraguayans
Immigrants from Guyana
73.7%
IN LABOR FORCE | AGE 20-24
0.8/ 100
METRIC RATING
257th/ 347
METRIC RANK
69.3%
IN LABOR FORCE | AGE 20-24
0.0/ 100
METRIC RATING
336th/ 347
METRIC RANK
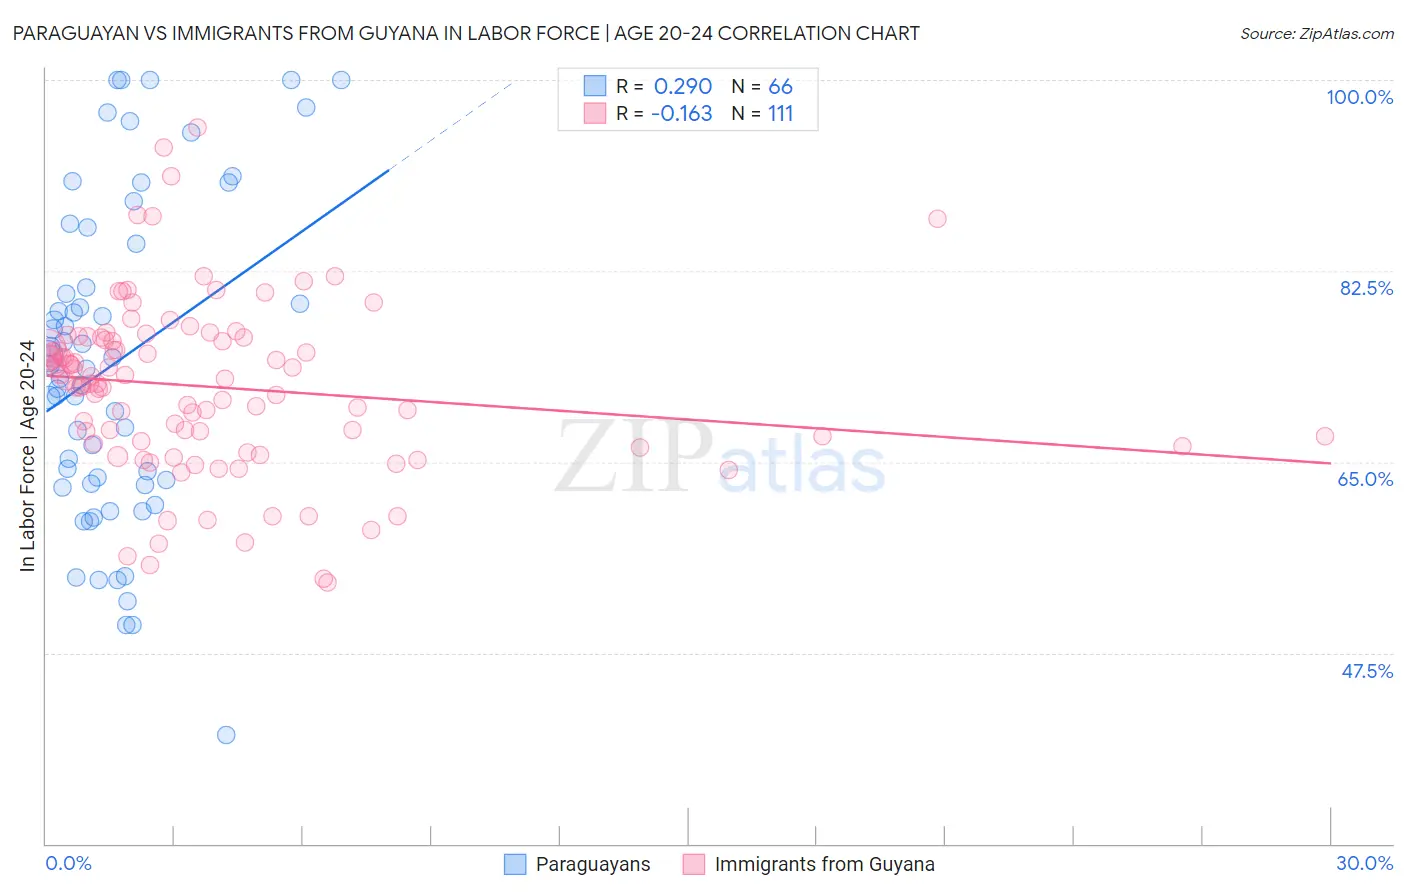
Paraguayan vs Immigrants from Guyana In Labor Force | Age 20-24 Correlation Chart
The statistical analysis conducted on geographies consisting of 95,113,378 people shows a weak positive correlation between the proportion of Paraguayans and labor force participation rate among population between the ages 20 and 24 in the United States with a correlation coefficient (R) of 0.290 and weighted average of 73.7%. Similarly, the statistical analysis conducted on geographies consisting of 183,673,917 people shows a poor negative correlation between the proportion of Immigrants from Guyana and labor force participation rate among population between the ages 20 and 24 in the United States with a correlation coefficient (R) of -0.163 and weighted average of 69.3%, a difference of 6.4%.
In Labor Force | Age 20-24 Correlation Summary
| Measurement | Paraguayan | Immigrants from Guyana |
| Minimum | 40.0% | 54.0% |
| Maximum | 100.0% | 95.7% |
| Range | 60.0% | 41.7% |
| Mean | 74.1% | 71.9% |
| Median | 73.7% | 72.4% |
| Interquartile 25% (IQ1) | 63.0% | 66.7% |
| Interquartile 75% (IQ3) | 85.0% | 76.4% |
| Interquartile Range (IQR) | 22.0% | 9.7% |
| Standard Deviation (Sample) | 14.7% | 7.9% |
| Standard Deviation (Population) | 14.6% | 7.8% |
Similar Demographics by In Labor Force | Age 20-24
Demographics Similar to Paraguayans by In Labor Force | Age 20-24
In terms of in labor force | age 20-24, the demographic groups most similar to Paraguayans are Spanish American Indian (73.7%, a difference of 0.020%), Egyptian (73.7%, a difference of 0.040%), Dutch West Indian (73.7%, a difference of 0.040%), Immigrants from Pakistan (73.8%, a difference of 0.060%), and Immigrants from Turkey (73.7%, a difference of 0.070%).
| Demographics | Rating | Rank | In Labor Force | Age 20-24 |
| Immigrants | Belgium | 1.3 /100 | #250 | Tragic 73.9% |
| Immigrants | Egypt | 1.2 /100 | #251 | Tragic 73.8% |
| Immigrants | Kazakhstan | 1.1 /100 | #252 | Tragic 73.8% |
| Arapaho | 1.0 /100 | #253 | Tragic 73.8% |
| Ute | 1.0 /100 | #254 | Tragic 73.8% |
| Immigrants | Pakistan | 0.9 /100 | #255 | Tragic 73.8% |
| Spanish American Indians | 0.8 /100 | #256 | Tragic 73.7% |
| Paraguayans | 0.8 /100 | #257 | Tragic 73.7% |
| Egyptians | 0.7 /100 | #258 | Tragic 73.7% |
| Dutch West Indians | 0.7 /100 | #259 | Tragic 73.7% |
| Immigrants | Turkey | 0.7 /100 | #260 | Tragic 73.7% |
| Houma | 0.6 /100 | #261 | Tragic 73.7% |
| Asians | 0.6 /100 | #262 | Tragic 73.7% |
| Immigrants | Asia | 0.5 /100 | #263 | Tragic 73.6% |
| Immigrants | Haiti | 0.5 /100 | #264 | Tragic 73.6% |
Demographics Similar to Immigrants from Guyana by In Labor Force | Age 20-24
In terms of in labor force | age 20-24, the demographic groups most similar to Immigrants from Guyana are Guyanese (69.2%, a difference of 0.13%), Pima (69.0%, a difference of 0.39%), Immigrants from Yemen (68.9%, a difference of 0.52%), Immigrants from Barbados (69.7%, a difference of 0.66%), and Menominee (68.7%, a difference of 0.83%).
| Demographics | Rating | Rank | In Labor Force | Age 20-24 |
| Yup'ik | 0.0 /100 | #329 | Tragic 70.9% |
| Vietnamese | 0.0 /100 | #330 | Tragic 70.6% |
| Immigrants | Bangladesh | 0.0 /100 | #331 | Tragic 70.6% |
| Immigrants | Uzbekistan | 0.0 /100 | #332 | Tragic 70.4% |
| Yuman | 0.0 /100 | #333 | Tragic 70.3% |
| British West Indians | 0.0 /100 | #334 | Tragic 70.0% |
| Immigrants | Barbados | 0.0 /100 | #335 | Tragic 69.7% |
| Immigrants | Guyana | 0.0 /100 | #336 | Tragic 69.3% |
| Guyanese | 0.0 /100 | #337 | Tragic 69.2% |
| Pima | 0.0 /100 | #338 | Tragic 69.0% |
| Immigrants | Yemen | 0.0 /100 | #339 | Tragic 68.9% |
| Menominee | 0.0 /100 | #340 | Tragic 68.7% |
| Tohono O'odham | 0.0 /100 | #341 | Tragic 68.6% |
| Immigrants | St. Vincent and the Grenadines | 0.0 /100 | #342 | Tragic 68.4% |
| Puerto Ricans | 0.0 /100 | #343 | Tragic 68.3% |