Panamanian vs Immigrants from Central America In Labor Force | Age 16-19
COMPARE
Panamanian
Immigrants from Central America
In Labor Force | Age 16-19
In Labor Force | Age 16-19 Comparison
Panamanians
Immigrants from Central America
36.1%
IN LABOR FORCE | AGE 16-19
28.6/ 100
METRIC RATING
190th/ 347
METRIC RANK
35.0%
IN LABOR FORCE | AGE 16-19
3.0/ 100
METRIC RATING
240th/ 347
METRIC RANK
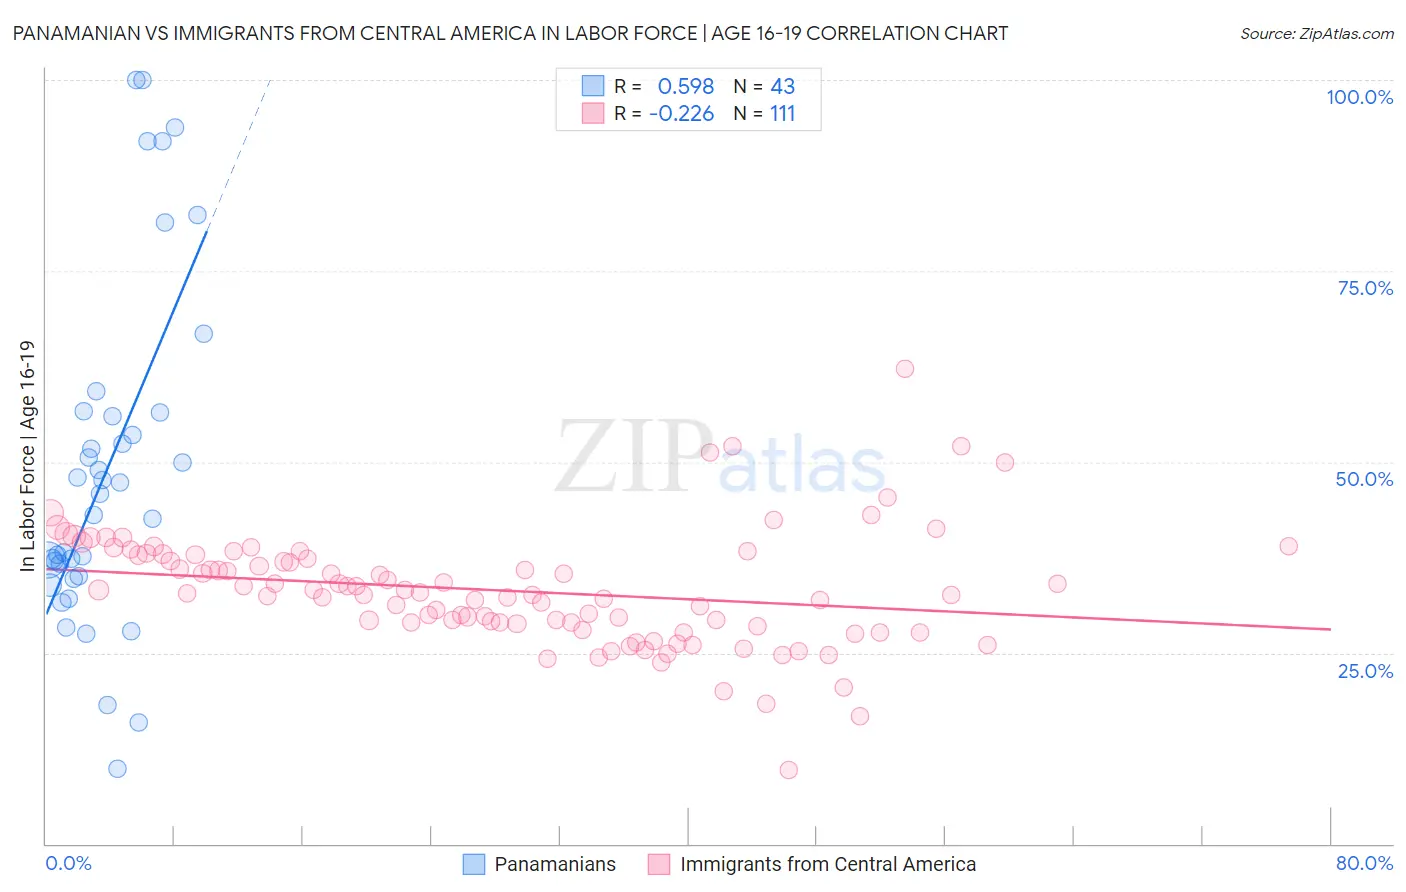
Panamanian vs Immigrants from Central America In Labor Force | Age 16-19 Correlation Chart
The statistical analysis conducted on geographies consisting of 281,056,655 people shows a substantial positive correlation between the proportion of Panamanians and labor force participation rate among population between the ages 16 and 19 in the United States with a correlation coefficient (R) of 0.598 and weighted average of 36.1%. Similarly, the statistical analysis conducted on geographies consisting of 534,055,190 people shows a weak negative correlation between the proportion of Immigrants from Central America and labor force participation rate among population between the ages 16 and 19 in the United States with a correlation coefficient (R) of -0.226 and weighted average of 35.0%, a difference of 3.4%.
In Labor Force | Age 16-19 Correlation Summary
| Measurement | Panamanian | Immigrants from Central America |
| Minimum | 9.9% | 9.7% |
| Maximum | 100.0% | 62.2% |
| Range | 90.1% | 52.5% |
| Mean | 49.1% | 33.2% |
| Median | 45.8% | 32.8% |
| Interquartile 25% (IQ1) | 35.1% | 28.8% |
| Interquartile 75% (IQ3) | 56.4% | 37.9% |
| Interquartile Range (IQR) | 21.3% | 9.1% |
| Standard Deviation (Sample) | 22.4% | 7.6% |
| Standard Deviation (Population) | 22.1% | 7.5% |
Similar Demographics by In Labor Force | Age 16-19
Demographics Similar to Panamanians by In Labor Force | Age 16-19
In terms of in labor force | age 16-19, the demographic groups most similar to Panamanians are Immigrants from Hungary (36.2%, a difference of 0.010%), Immigrants from Croatia (36.1%, a difference of 0.070%), Immigrants from Europe (36.2%, a difference of 0.19%), Afghan (36.1%, a difference of 0.19%), and Immigrants from Denmark (36.1%, a difference of 0.23%).
| Demographics | Rating | Rank | In Labor Force | Age 16-19 |
| Eastern Europeans | 38.8 /100 | #183 | Fair 36.4% |
| Costa Ricans | 36.1 /100 | #184 | Fair 36.3% |
| Bhutanese | 35.3 /100 | #185 | Fair 36.3% |
| Immigrants | Romania | 34.0 /100 | #186 | Fair 36.3% |
| Immigrants | Afghanistan | 34.0 /100 | #187 | Fair 36.3% |
| Immigrants | Europe | 31.8 /100 | #188 | Fair 36.2% |
| Immigrants | Hungary | 28.8 /100 | #189 | Fair 36.2% |
| Panamanians | 28.6 /100 | #190 | Fair 36.1% |
| Immigrants | Croatia | 27.5 /100 | #191 | Fair 36.1% |
| Afghans | 25.7 /100 | #192 | Fair 36.1% |
| Immigrants | Denmark | 25.0 /100 | #193 | Fair 36.1% |
| Nigerians | 24.6 /100 | #194 | Fair 36.1% |
| Bolivians | 23.3 /100 | #195 | Fair 36.0% |
| Mexican American Indians | 21.1 /100 | #196 | Fair 36.0% |
| Immigrants | Serbia | 21.0 /100 | #197 | Fair 36.0% |
Demographics Similar to Immigrants from Central America by In Labor Force | Age 16-19
In terms of in labor force | age 16-19, the demographic groups most similar to Immigrants from Central America are Immigrants from Ireland (35.0%, a difference of 0.030%), Inupiat (35.0%, a difference of 0.10%), Uruguayan (34.9%, a difference of 0.15%), Pueblo (34.9%, a difference of 0.18%), and Immigrants from Vietnam (35.0%, a difference of 0.19%).
| Demographics | Rating | Rank | In Labor Force | Age 16-19 |
| Immigrants | France | 4.3 /100 | #233 | Tragic 35.1% |
| Immigrants | Mexico | 4.2 /100 | #234 | Tragic 35.1% |
| Immigrants | Philippines | 4.0 /100 | #235 | Tragic 35.1% |
| Immigrants | Australia | 3.6 /100 | #236 | Tragic 35.1% |
| Immigrants | India | 3.5 /100 | #237 | Tragic 35.0% |
| Immigrants | Vietnam | 3.4 /100 | #238 | Tragic 35.0% |
| Inupiat | 3.2 /100 | #239 | Tragic 35.0% |
| Immigrants | Central America | 3.0 /100 | #240 | Tragic 35.0% |
| Immigrants | Ireland | 2.9 /100 | #241 | Tragic 35.0% |
| Uruguayans | 2.6 /100 | #242 | Tragic 34.9% |
| Pueblo | 2.6 /100 | #243 | Tragic 34.9% |
| Immigrants | Turkey | 2.6 /100 | #244 | Tragic 34.9% |
| Immigrants | Greece | 2.4 /100 | #245 | Tragic 34.9% |
| Immigrants | Sri Lanka | 2.4 /100 | #246 | Tragic 34.9% |
| Laotians | 2.4 /100 | #247 | Tragic 34.9% |