Palestinian vs Costa Rican In Labor Force | Age 30-34

COMPARE

Palestinian
Race
Ancestry
AfghanAfricanAlaska NativeAlaskan AthabascanAlbanianAleutAlsatianAmericanApacheArabArapahoArgentineanArmenianAssyrian/Chaldean/SyriacAustralianAustrianBahamianBangladeshiBarbadianBasqueBelgianBelizeanBermudanBhutaneseBlackfeetBolivianBrazilianBritishBritish West IndianBulgarianBurmeseCajunCambodianCanadianCape VerdeanCarpatho RusynCelticCentral AmericanCentral American IndianCherokeeCheyenneChickasawChileanChineseChippewaChoctawColombianColvilleComancheCreeCreekCroatianCrowCubanCypriotCzechCzechoslovakianDanishDelawareDominicanDutchDutch West IndianEastern EuropeanEcuadorianEgyptianEnglishEstonianEthiopianEuropeanFijianFilipinoFinnishFrenchFrench American IndianFrench CanadianGermanGerman RussianGhanaianGreekGuamanian/ChamorroGuatemalanGuyaneseHaitianHmongHonduranHopiHoumaHungarianIcelanderIndian (Asian)IndonesianInupiatIranianIraqiIrishIroquoisIsraeliItalianJamaicanJapaneseJordanianKenyanKiowaKoreanLaotianLatvianLebaneseLiberianLithuanianLumbeeLuxembourgerMacedonianMalaysianMalteseMarshalleseMenomineeMexicanMexican American IndianMongolianMoroccanNative HawaiianNavajoNepaleseNew ZealanderNicaraguanNigerianNorthern EuropeanNorwegianOkinawanOsageOttawaPaiutePakistaniPalestinianPanamanianParaguayanPennsylvania GermanPeruvianPimaPolishPortuguesePotawatomiPuebloPuerto RicanPuget Sound SalishRomanianRussianSalvadoranSamoanScandinavianScotch-IrishScottishSeminoleSenegaleseSerbianShoshoneSierra LeoneanSiouxSlavicSlovakSloveneSomaliSouth AfricanSouth AmericanSouth American IndianSoviet UnionSpaniardSpanishSpanish AmericanSpanish American IndianSri LankanSubsaharan AfricanSudaneseSwedishSwissSyrianTaiwaneseThaiTlingit-HaidaTohono O'OdhamTonganTrinidadian and TobagonianTsimshianTurkishU.S. Virgin IslanderUgandanUkrainianUruguayanUteVenezuelanVietnameseWelshWest IndianYakamaYaquiYugoslavianYumanYup'ikZimbabwean
Immigration
NonimmigrantsImmigrantsAfghanistanAfricaAlbaniaArgentinaArmeniaAsiaAustraliaAustriaBahamasBangladeshBarbadosBelarusBelgiumBelizeBoliviaBosnia and HerzegovinaBrazilBulgariaBurma/MyanmarCabo VerdeCambodiaCameroonCanadaCaribbeanCentral AmericaChileChinaColombiaCongoCosta RicaCroatiaCubaCzechoslovakiaDenmarkDominicaDominican RepublicEastern AfricaEastern AsiaEastern EuropeEcuadorEgyptEl SalvadorEnglandEritreaEthiopiaEuropeFijiFranceGermanyGhanaGreeceGrenadaGuatemalaGuyanaHaitiHondurasHong KongHungaryIndiaIndonesiaIranIraqIrelandIsraelItalyJamaicaJapanJordanKazakhstanKenyaKoreaKuwaitLaosLatin AmericaLatviaLebanonLiberiaLithuaniaMalaysiaMexicoMicronesiaMiddle AfricaMoldovaMoroccoNepalNetherlandsNicaraguaNigeriaNorth AmericaNorth MacedoniaNorthern AfricaNorthern EuropeNorwayOceaniaPakistanPanamaPeruPhilippinesPolandPortugalRomaniaRussiaSaudi ArabiaScotlandSenegalSerbiaSierra LeoneSingaporeSomaliaSouth AfricaSouth AmericaSouth Central AsiaSouth Eastern AsiaSouthern EuropeSpainSri LankaSt. Vincent and the GrenadinesSudanSwedenSwitzerlandSyriaTaiwanThailandTrinidad and TobagoTurkeyUgandaUkraineUruguayUzbekistanVenezuelaVietnamWest IndiesWestern AfricaWestern AsiaWestern EuropeYemenZaireZimbabweAzores
Costa Rican
Race
Ancestry
AfghanAfricanAlaska NativeAlaskan AthabascanAlbanianAleutAlsatianAmericanApacheArabArapahoArgentineanArmenianAssyrian/Chaldean/SyriacAustralianAustrianBahamianBangladeshiBarbadianBasqueBelgianBelizeanBermudanBhutaneseBlackfeetBolivianBrazilianBritishBritish West IndianBulgarianBurmeseCajunCambodianCanadianCape VerdeanCarpatho RusynCelticCentral AmericanCentral American IndianCherokeeCheyenneChickasawChileanChineseChippewaChoctawColombianColvilleComancheCosta RicanCreeCreekCroatianCrowCubanCypriotCzechCzechoslovakianDanishDelawareDominicanDutchDutch West IndianEastern EuropeanEcuadorianEgyptianEnglishEstonianEthiopianEuropeanFijianFilipinoFinnishFrenchFrench American IndianFrench CanadianGermanGerman RussianGhanaianGreekGuamanian/ChamorroGuatemalanGuyaneseHaitianHmongHonduranHopiHoumaHungarianIcelanderIndian (Asian)IndonesianInupiatIranianIraqiIrishIroquoisIsraeliItalianJamaicanJapaneseJordanianKenyanKiowaKoreanLaotianLatvianLebaneseLiberianLithuanianLumbeeLuxembourgerMacedonianMalaysianMalteseMarshalleseMenomineeMexicanMexican American IndianMongolianMoroccanNative HawaiianNavajoNepaleseNew ZealanderNicaraguanNigerianNorthern EuropeanNorwegianOkinawanOsageOttawaPaiutePakistaniPanamanianParaguayanPennsylvania GermanPeruvianPimaPolishPortuguesePotawatomiPuebloPuerto RicanPuget Sound SalishRomanianRussianSalvadoranSamoanScandinavianScotch-IrishScottishSeminoleSenegaleseSerbianShoshoneSierra LeoneanSiouxSlavicSlovakSloveneSomaliSouth AfricanSouth AmericanSouth American IndianSoviet UnionSpaniardSpanishSpanish AmericanSpanish American IndianSri LankanSubsaharan AfricanSudaneseSwedishSwissSyrianTaiwaneseThaiTlingit-HaidaTohono O'OdhamTonganTrinidadian and TobagonianTsimshianTurkishU.S. Virgin IslanderUgandanUkrainianUruguayanUteVenezuelanVietnameseWelshWest IndianYakamaYaquiYugoslavianYumanYup'ikZimbabwean
Immigration
NonimmigrantsImmigrantsAfghanistanAfricaAlbaniaArgentinaArmeniaAsiaAustraliaAustriaBahamasBangladeshBarbadosBelarusBelgiumBelizeBoliviaBosnia and HerzegovinaBrazilBulgariaBurma/MyanmarCabo VerdeCambodiaCameroonCanadaCaribbeanCentral AmericaChileChinaColombiaCongoCosta RicaCroatiaCubaCzechoslovakiaDenmarkDominicaDominican RepublicEastern AfricaEastern AsiaEastern EuropeEcuadorEgyptEl SalvadorEnglandEritreaEthiopiaEuropeFijiFranceGermanyGhanaGreeceGrenadaGuatemalaGuyanaHaitiHondurasHong KongHungaryIndiaIndonesiaIranIraqIrelandIsraelItalyJamaicaJapanJordanKazakhstanKenyaKoreaKuwaitLaosLatin AmericaLatviaLebanonLiberiaLithuaniaMalaysiaMexicoMicronesiaMiddle AfricaMoldovaMoroccoNepalNetherlandsNicaraguaNigeriaNorth AmericaNorth MacedoniaNorthern AfricaNorthern EuropeNorwayOceaniaPakistanPanamaPeruPhilippinesPolandPortugalRomaniaRussiaSaudi ArabiaScotlandSenegalSerbiaSierra LeoneSingaporeSomaliaSouth AfricaSouth AmericaSouth Central AsiaSouth Eastern AsiaSouthern EuropeSpainSri LankaSt. Vincent and the GrenadinesSudanSwedenSwitzerlandSyriaTaiwanThailandTrinidad and TobagoTurkeyUgandaUkraineUruguayUzbekistanVenezuelaVietnamWest IndiesWestern AfricaWestern AsiaWestern EuropeYemenZaireZimbabweAzores
In Labor Force | Age 30-34
Income
Poverty
Unemployment
Labor Participation
Family Structure
Vehicle Availability
Education Level
Disability

In Labor Force | Age 30-34 Comparison

Palestinians

Costa Ricans

Good
Fair
84.9%
IN LABOR FORCE | AGE 30-34
77.7/ 100
METRIC RATING
145th/ 347
METRIC RANK
84.6%
IN LABOR FORCE | AGE 30-34
29.6/ 100
METRIC RATING
187th/ 347
METRIC RANK

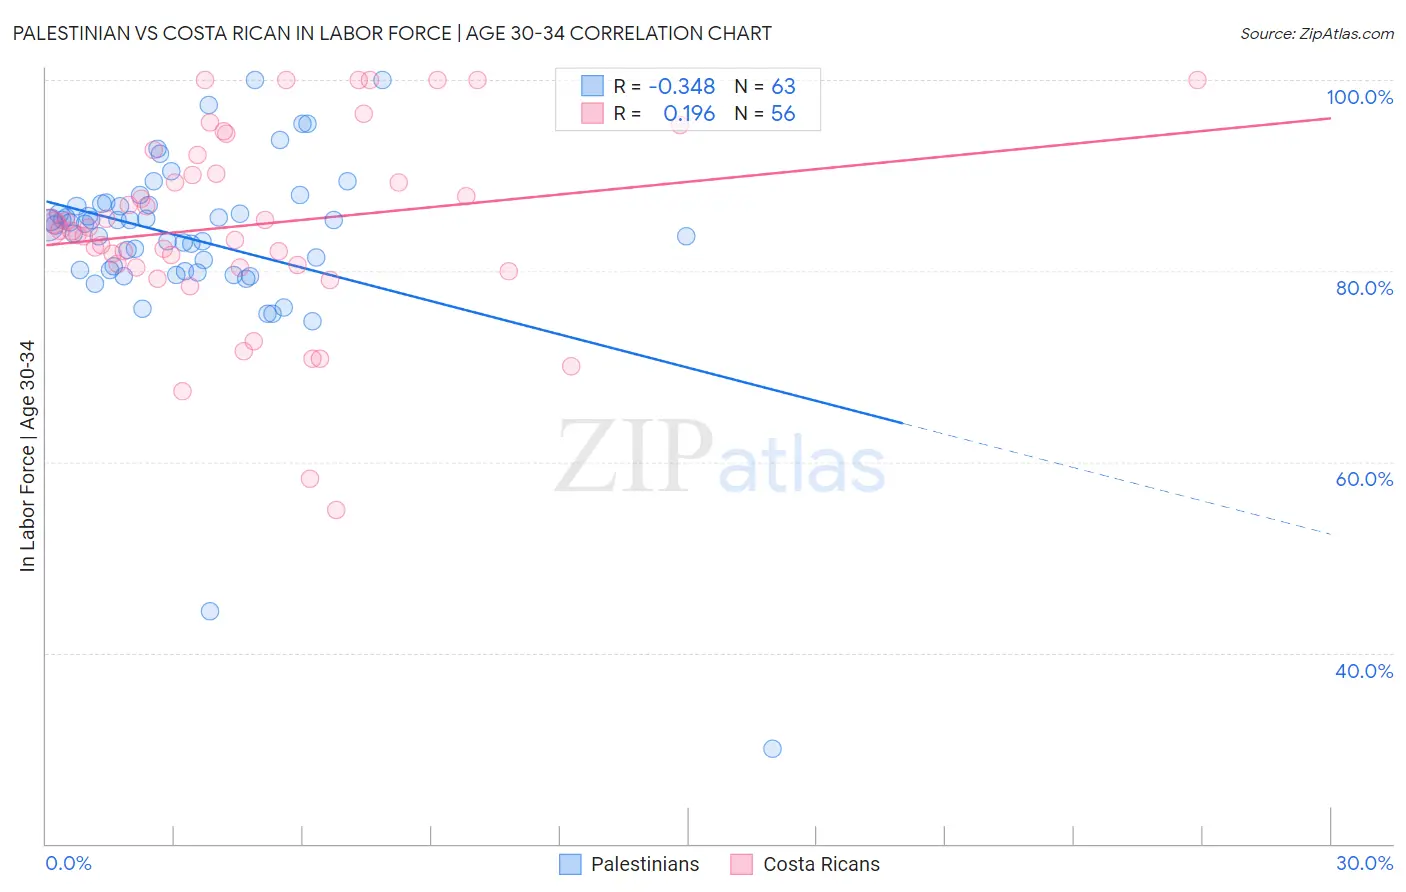
Palestinian vs Costa Rican In Labor Force | Age 30-34 Correlation Chart

The statistical analysis conducted on geographies consisting of 216,407,612 people shows a mild negative correlation between the proportion of Palestinians and labor force participation rate among population between the ages 30 and 34 in the United States with a correlation coefficient (R) of -0.348 and weighted average of 84.9%. Similarly, the statistical analysis conducted on geographies consisting of 253,513,435 people shows a poor positive correlation between the proportion of Costa Ricans and labor force participation rate among population between the ages 30 and 34 in the United States with a correlation coefficient (R) of 0.196 and weighted average of 84.6%, a difference of 0.37%.
Palestinian vs Costa Rican In Labor Force | Age 30-34

In Labor Force | Age 30-34 Correlation Summary

MeasurementPalestinianCosta Rican
Minimum30.0%55.0%
Maximum100.0%100.0%
Range70.0%45.0%
Mean83.4%84.8%
Median84.9%84.4%
Interquartile 25% (IQ1)80.1%80.5%
Interquartile 75% (IQ3)86.9%91.2%
Interquartile Range (IQR)6.8%10.7%
Standard Deviation (Sample)10.2%10.0%
Standard Deviation (Population)10.1%9.9%

Similar Demographics by In Labor Force | Age 30-34

Demographics Similar to Palestinians by In Labor Force | Age 30-34

In terms of in labor force | age 30-34, the demographic groups most similar to Palestinians are Uruguayan (84.9%, a difference of 0.010%), Immigrants from Saudi Arabia (84.9%, a difference of 0.010%), Immigrants from Colombia (84.9%, a difference of 0.010%), Immigrants from Pakistan (84.9%, a difference of 0.010%), and Immigrants from Ukraine (84.8%, a difference of 0.020%).
DemographicsRating | RankIn Labor Force | Age 30-34
Sri Lankans
87.8
/100
|
#138
Excellent
85.0%
Bhutanese
87.5
/100
|
#139
Excellent
85.0%
Immigrants | Vietnam
86.5
/100
|
#140
Excellent
85.0%
Chileans
85.3
/100
|
#141
Excellent
84.9%
Immigrants | Indonesia
84.3
/100
|
#142
Excellent
84.9%
Colombians
82.2
/100
|
#143
Excellent
84.9%
Uruguayans
78.5
/100
|
#144
Good
84.9%
Palestinians
77.7
/100
|
#145
Good
84.9%
Immigrants | Saudi Arabia
76.6
/100
|
#146
Good
84.9%
Immigrants | Colombia
76.3
/100
|
#147
Good
84.9%
Immigrants | Pakistan
76.2
/100
|
#148
Good
84.9%
Immigrants | Ukraine
75.1
/100
|
#149
Good
84.8%
Germans
75.1
/100
|
#150
Good
84.8%
Immigrants | Senegal
74.0
/100
|
#151
Good
84.8%
Romanians
73.5
/100
|
#152
Good
84.8%

Demographics Similar to Costa Ricans by In Labor Force | Age 30-34

In terms of in labor force | age 30-34, the demographic groups most similar to Costa Ricans are Immigrants from Congo (84.6%, a difference of 0.0%), Taiwanese (84.6%, a difference of 0.0%), Nigerian (84.5%, a difference of 0.010%), Immigrants from Philippines (84.6%, a difference of 0.020%), and Immigrants from North America (84.6%, a difference of 0.030%).
DemographicsRating | RankIn Labor Force | Age 30-34
Immigrants | Netherlands
42.1
/100
|
#180
Average
84.6%
Moroccans
40.3
/100
|
#181
Average
84.6%
Barbadians
36.7
/100
|
#182
Fair
84.6%
Immigrants | Canada
35.0
/100
|
#183
Fair
84.6%
Immigrants | North America
33.3
/100
|
#184
Fair
84.6%
Immigrants | Philippines
31.5
/100
|
#185
Fair
84.6%
Immigrants | Congo
29.7
/100
|
#186
Fair
84.6%
Costa Ricans
29.6
/100
|
#187
Fair
84.6%
Taiwanese
29.4
/100
|
#188
Fair
84.6%
Nigerians
28.9
/100
|
#189
Fair
84.5%
Immigrants | Zaire
25.8
/100
|
#190
Fair
84.5%
Hungarians
24.8
/100
|
#191
Fair
84.5%
Scandinavians
24.7
/100
|
#192
Fair
84.5%
Immigrants | Costa Rica
23.9
/100
|
#193
Fair
84.5%
Immigrants | Afghanistan
23.5
/100
|
#194
Fair
84.5%