Paiute vs Immigrants from Ethiopia In Labor Force | Age 20-64
COMPARE
Paiute
Immigrants from Ethiopia
In Labor Force | Age 20-64
In Labor Force | Age 20-64 Comparison
Paiute
Immigrants from Ethiopia
74.7%
IN LABOR FORCE | AGE 20-64
0.0/ 100
METRIC RATING
331st/ 347
METRIC RANK
82.1%
IN LABOR FORCE | AGE 20-64
100.0/ 100
METRIC RATING
1st/ 347
METRIC RANK
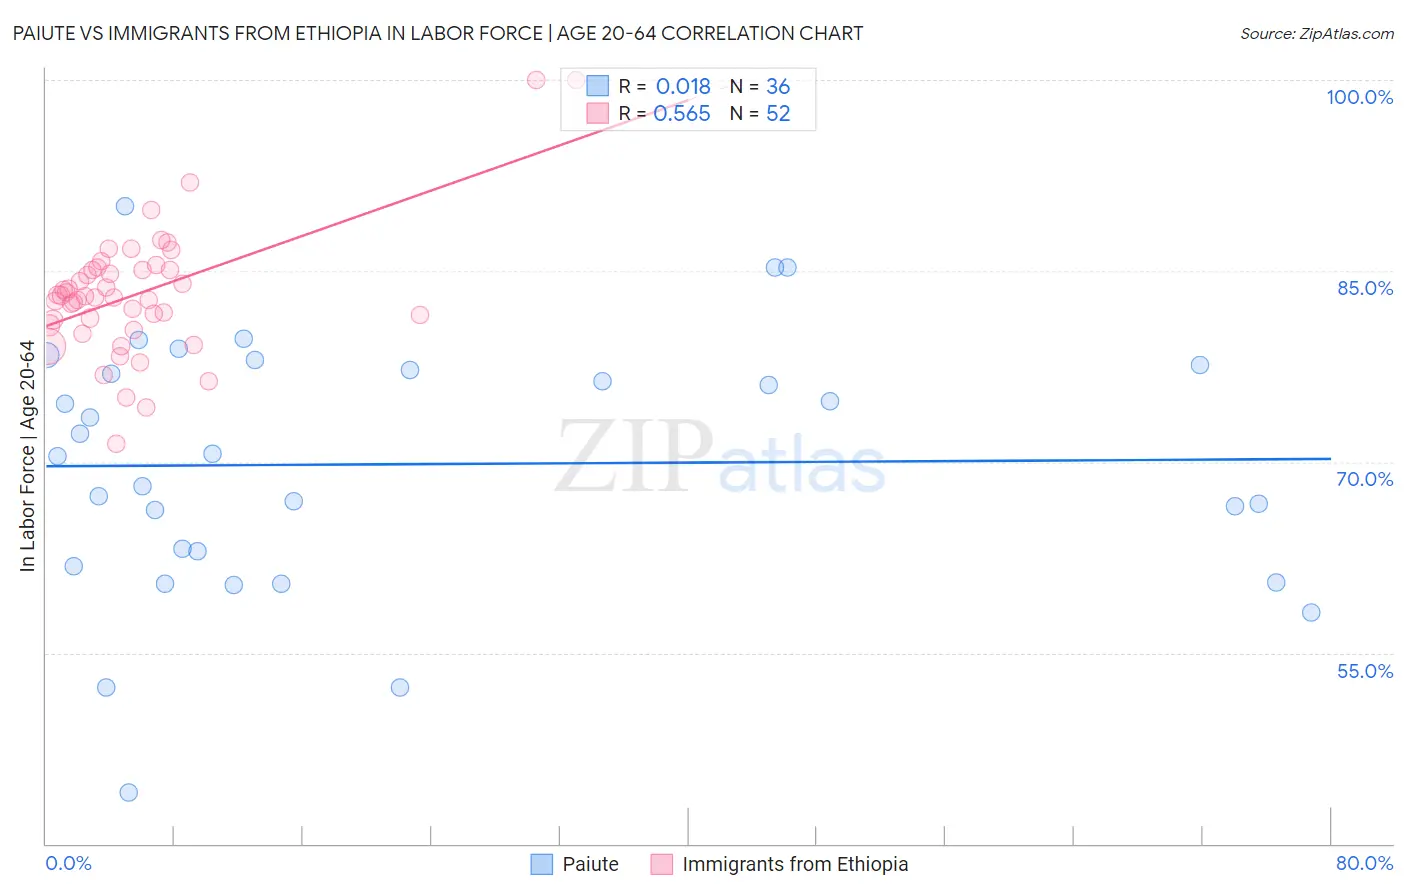
Paiute vs Immigrants from Ethiopia In Labor Force | Age 20-64 Correlation Chart
The statistical analysis conducted on geographies consisting of 58,399,197 people shows no correlation between the proportion of Paiute and labor force participation rate among population between the ages 20 and 64 in the United States with a correlation coefficient (R) of 0.018 and weighted average of 74.7%. Similarly, the statistical analysis conducted on geographies consisting of 211,573,899 people shows a substantial positive correlation between the proportion of Immigrants from Ethiopia and labor force participation rate among population between the ages 20 and 64 in the United States with a correlation coefficient (R) of 0.565 and weighted average of 82.1%, a difference of 9.9%.
In Labor Force | Age 20-64 Correlation Summary
| Measurement | Paiute | Immigrants from Ethiopia |
| Minimum | 44.1% | 71.4% |
| Maximum | 90.1% | 100.0% |
| Range | 46.0% | 28.6% |
| Mean | 69.8% | 83.2% |
| Median | 70.5% | 83.0% |
| Interquartile 25% (IQ1) | 62.4% | 81.0% |
| Interquartile 75% (IQ3) | 77.4% | 85.1% |
| Interquartile Range (IQR) | 15.0% | 4.1% |
| Standard Deviation (Sample) | 10.1% | 5.1% |
| Standard Deviation (Population) | 10.0% | 5.0% |
Similar Demographics by In Labor Force | Age 20-64
Demographics Similar to Paiute by In Labor Force | Age 20-64
In terms of in labor force | age 20-64, the demographic groups most similar to Paiute are Colville (74.8%, a difference of 0.13%), Cheyenne (74.8%, a difference of 0.20%), Kiowa (75.0%, a difference of 0.40%), Arapaho (74.4%, a difference of 0.40%), and Sioux (75.0%, a difference of 0.43%).
| Demographics | Rating | Rank | In Labor Force | Age 20-64 |
| Choctaw | 0.0 /100 | #324 | Tragic 75.4% |
| Menominee | 0.0 /100 | #325 | Tragic 75.3% |
| Creek | 0.0 /100 | #326 | Tragic 75.1% |
| Sioux | 0.0 /100 | #327 | Tragic 75.0% |
| Kiowa | 0.0 /100 | #328 | Tragic 75.0% |
| Cheyenne | 0.0 /100 | #329 | Tragic 74.8% |
| Colville | 0.0 /100 | #330 | Tragic 74.8% |
| Paiute | 0.0 /100 | #331 | Tragic 74.7% |
| Arapaho | 0.0 /100 | #332 | Tragic 74.4% |
| Natives/Alaskans | 0.0 /100 | #333 | Tragic 73.9% |
| Apache | 0.0 /100 | #334 | Tragic 73.7% |
| Ute | 0.0 /100 | #335 | Tragic 73.7% |
| Crow | 0.0 /100 | #336 | Tragic 73.3% |
| Yup'ik | 0.0 /100 | #337 | Tragic 73.2% |
| Puerto Ricans | 0.0 /100 | #338 | Tragic 73.1% |
Demographics Similar to Immigrants from Ethiopia by In Labor Force | Age 20-64
In terms of in labor force | age 20-64, the demographic groups most similar to Immigrants from Ethiopia are Ethiopian (82.0%, a difference of 0.12%), Immigrants from Bolivia (81.9%, a difference of 0.13%), Luxembourger (81.9%, a difference of 0.25%), Bolivian (81.7%, a difference of 0.45%), and Somali (81.6%, a difference of 0.56%).
| Demographics | Rating | Rank | In Labor Force | Age 20-64 |
| Immigrants | Ethiopia | 100.0 /100 | #1 | Exceptional 82.1% |
| Ethiopians | 100.0 /100 | #2 | Exceptional 82.0% |
| Immigrants | Bolivia | 100.0 /100 | #3 | Exceptional 81.9% |
| Luxembourgers | 100.0 /100 | #4 | Exceptional 81.9% |
| Bolivians | 100.0 /100 | #5 | Exceptional 81.7% |
| Somalis | 100.0 /100 | #6 | Exceptional 81.6% |
| Immigrants | Cameroon | 100.0 /100 | #7 | Exceptional 81.6% |
| Immigrants | Somalia | 100.0 /100 | #8 | Exceptional 81.6% |
| Sierra Leoneans | 100.0 /100 | #9 | Exceptional 81.5% |
| Immigrants | Sierra Leone | 100.0 /100 | #10 | Exceptional 81.5% |
| Immigrants | Eastern Africa | 100.0 /100 | #11 | Exceptional 81.3% |
| Immigrants | Eritrea | 100.0 /100 | #12 | Exceptional 81.3% |
| Immigrants | India | 100.0 /100 | #13 | Exceptional 81.3% |
| Cambodians | 100.0 /100 | #14 | Exceptional 81.1% |
| Bulgarians | 100.0 /100 | #15 | Exceptional 81.1% |