Ottawa vs Immigrants from India In Labor Force | Age 20-64
COMPARE
Ottawa
Immigrants from India
In Labor Force | Age 20-64
In Labor Force | Age 20-64 Comparison
Ottawa
Immigrants from India
76.7%
IN LABOR FORCE | AGE 20-64
0.0/ 100
METRIC RATING
315th/ 347
METRIC RANK
81.3%
IN LABOR FORCE | AGE 20-64
100.0/ 100
METRIC RATING
13th/ 347
METRIC RANK
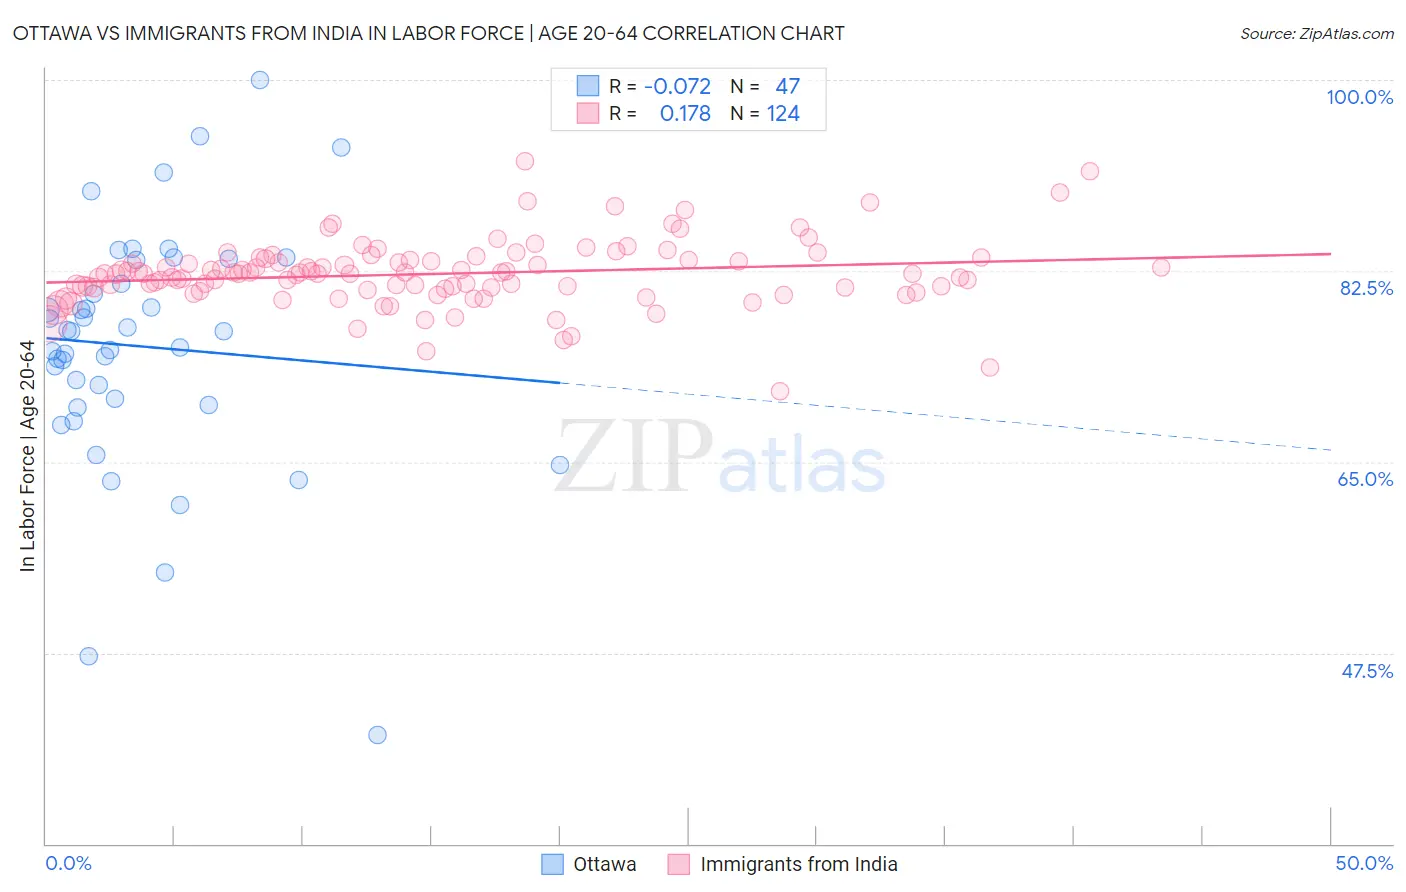
Ottawa vs Immigrants from India In Labor Force | Age 20-64 Correlation Chart
The statistical analysis conducted on geographies consisting of 49,955,365 people shows a slight negative correlation between the proportion of Ottawa and labor force participation rate among population between the ages 20 and 64 in the United States with a correlation coefficient (R) of -0.072 and weighted average of 76.7%. Similarly, the statistical analysis conducted on geographies consisting of 434,133,401 people shows a poor positive correlation between the proportion of Immigrants from India and labor force participation rate among population between the ages 20 and 64 in the United States with a correlation coefficient (R) of 0.178 and weighted average of 81.3%, a difference of 6.0%.
In Labor Force | Age 20-64 Correlation Summary
| Measurement | Ottawa | Immigrants from India |
| Minimum | 40.0% | 71.5% |
| Maximum | 100.0% | 92.6% |
| Range | 60.0% | 21.1% |
| Mean | 75.6% | 82.2% |
| Median | 77.0% | 82.3% |
| Interquartile 25% (IQ1) | 70.2% | 80.9% |
| Interquartile 75% (IQ3) | 83.5% | 83.5% |
| Interquartile Range (IQR) | 13.3% | 2.6% |
| Standard Deviation (Sample) | 11.3% | 3.1% |
| Standard Deviation (Population) | 11.1% | 3.1% |
Similar Demographics by In Labor Force | Age 20-64
Demographics Similar to Ottawa by In Labor Force | Age 20-64
In terms of in labor force | age 20-64, the demographic groups most similar to Ottawa are Black/African American (76.8%, a difference of 0.10%), Shoshone (76.8%, a difference of 0.12%), Yaqui (76.5%, a difference of 0.19%), Alaskan Athabascan (76.9%, a difference of 0.24%), and Blackfeet (77.0%, a difference of 0.41%).
| Demographics | Rating | Rank | In Labor Force | Age 20-64 |
| Alaska Natives | 0.0 /100 | #308 | Tragic 77.0% |
| Americans | 0.0 /100 | #309 | Tragic 77.0% |
| Comanche | 0.0 /100 | #310 | Tragic 77.0% |
| Blackfeet | 0.0 /100 | #311 | Tragic 77.0% |
| Alaskan Athabascans | 0.0 /100 | #312 | Tragic 76.9% |
| Shoshone | 0.0 /100 | #313 | Tragic 76.8% |
| Blacks/African Americans | 0.0 /100 | #314 | Tragic 76.8% |
| Ottawa | 0.0 /100 | #315 | Tragic 76.7% |
| Yaqui | 0.0 /100 | #316 | Tragic 76.5% |
| Cherokee | 0.0 /100 | #317 | Tragic 76.2% |
| Chickasaw | 0.0 /100 | #318 | Tragic 76.2% |
| Inupiat | 0.0 /100 | #319 | Tragic 76.1% |
| Yakama | 0.0 /100 | #320 | Tragic 75.8% |
| Seminole | 0.0 /100 | #321 | Tragic 75.5% |
| Dutch West Indians | 0.0 /100 | #322 | Tragic 75.5% |
Demographics Similar to Immigrants from India by In Labor Force | Age 20-64
In terms of in labor force | age 20-64, the demographic groups most similar to Immigrants from India are Immigrants from Eritrea (81.3%, a difference of 0.030%), Immigrants from Eastern Africa (81.3%, a difference of 0.060%), Cambodian (81.1%, a difference of 0.24%), Immigrants from Sierra Leone (81.5%, a difference of 0.25%), and Bulgarian (81.1%, a difference of 0.25%).
| Demographics | Rating | Rank | In Labor Force | Age 20-64 |
| Somalis | 100.0 /100 | #6 | Exceptional 81.6% |
| Immigrants | Cameroon | 100.0 /100 | #7 | Exceptional 81.6% |
| Immigrants | Somalia | 100.0 /100 | #8 | Exceptional 81.6% |
| Sierra Leoneans | 100.0 /100 | #9 | Exceptional 81.5% |
| Immigrants | Sierra Leone | 100.0 /100 | #10 | Exceptional 81.5% |
| Immigrants | Eastern Africa | 100.0 /100 | #11 | Exceptional 81.3% |
| Immigrants | Eritrea | 100.0 /100 | #12 | Exceptional 81.3% |
| Immigrants | India | 100.0 /100 | #13 | Exceptional 81.3% |
| Cambodians | 100.0 /100 | #14 | Exceptional 81.1% |
| Bulgarians | 100.0 /100 | #15 | Exceptional 81.1% |
| Immigrants | Nepal | 100.0 /100 | #16 | Exceptional 81.1% |
| Norwegians | 100.0 /100 | #17 | Exceptional 81.0% |
| Immigrants | Bulgaria | 100.0 /100 | #18 | Exceptional 81.0% |
| Zimbabweans | 100.0 /100 | #19 | Exceptional 81.0% |
| Thais | 100.0 /100 | #20 | Exceptional 80.9% |