Osage vs Lumbee In Labor Force | Age > 16
COMPARE
Osage
Lumbee
In Labor Force | Age > 16
In Labor Force | Age > 16 Comparison
Osage
Lumbee
63.5%
IN LABOR FORCE | AGE > 16
0.0/ 100
METRIC RATING
305th/ 347
METRIC RANK
56.8%
IN LABOR FORCE | AGE > 16
0.0/ 100
METRIC RATING
346th/ 347
METRIC RANK
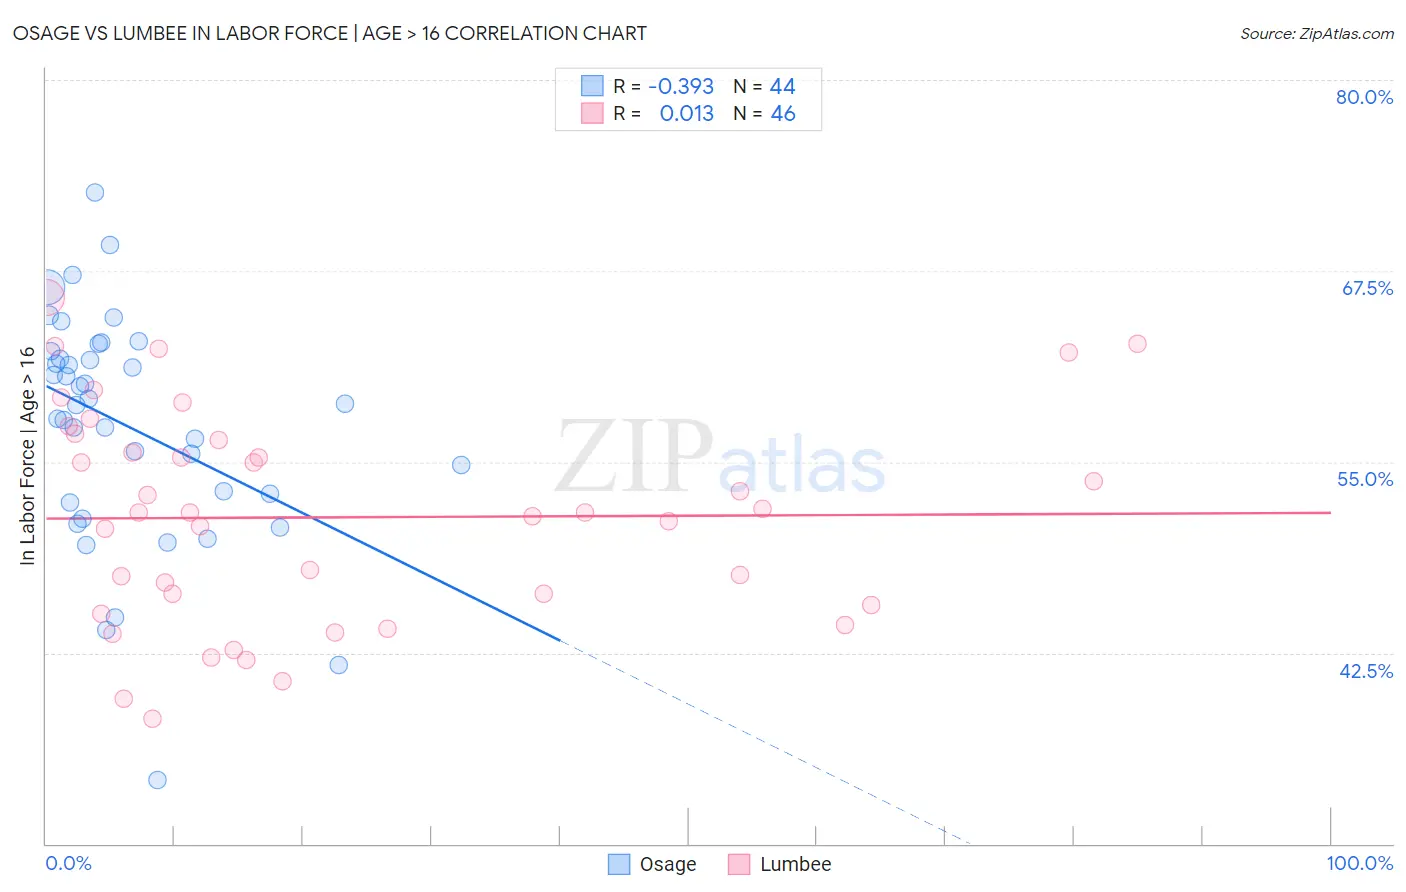
Osage vs Lumbee In Labor Force | Age > 16 Correlation Chart
The statistical analysis conducted on geographies consisting of 91,805,602 people shows a mild negative correlation between the proportion of Osage and labor force participation rate among population ages 16 and over in the United States with a correlation coefficient (R) of -0.393 and weighted average of 63.5%. Similarly, the statistical analysis conducted on geographies consisting of 92,293,168 people shows no correlation between the proportion of Lumbee and labor force participation rate among population ages 16 and over in the United States with a correlation coefficient (R) of 0.013 and weighted average of 56.8%, a difference of 11.8%.
In Labor Force | Age > 16 Correlation Summary
| Measurement | Osage | Lumbee |
| Minimum | 34.2% | 38.2% |
| Maximum | 72.7% | 65.7% |
| Range | 38.5% | 27.5% |
| Mean | 57.3% | 51.4% |
| Median | 58.8% | 51.7% |
| Interquartile 25% (IQ1) | 52.6% | 45.6% |
| Interquartile 75% (IQ3) | 62.0% | 56.4% |
| Interquartile Range (IQR) | 9.4% | 10.8% |
| Standard Deviation (Sample) | 7.5% | 7.0% |
| Standard Deviation (Population) | 7.4% | 6.9% |
Similar Demographics by In Labor Force | Age > 16
Demographics Similar to Osage by In Labor Force | Age > 16
In terms of in labor force | age > 16, the demographic groups most similar to Osage are Nonimmigrants (63.5%, a difference of 0.050%), Black/African American (63.4%, a difference of 0.090%), Cree (63.5%, a difference of 0.10%), Central American Indian (63.4%, a difference of 0.13%), and Delaware (63.6%, a difference of 0.14%).
| Demographics | Rating | Rank | In Labor Force | Age > 16 |
| Comanche | 0.0 /100 | #298 | Tragic 63.6% |
| Whites/Caucasians | 0.0 /100 | #299 | Tragic 63.6% |
| Immigrants | Azores | 0.0 /100 | #300 | Tragic 63.6% |
| Spanish Americans | 0.0 /100 | #301 | Tragic 63.6% |
| Delaware | 0.0 /100 | #302 | Tragic 63.6% |
| Cree | 0.0 /100 | #303 | Tragic 63.5% |
| Immigrants | Nonimmigrants | 0.0 /100 | #304 | Tragic 63.5% |
| Osage | 0.0 /100 | #305 | Tragic 63.5% |
| Blacks/African Americans | 0.0 /100 | #306 | Tragic 63.4% |
| Central American Indians | 0.0 /100 | #307 | Tragic 63.4% |
| Pennsylvania Germans | 0.0 /100 | #308 | Tragic 63.4% |
| Scotch-Irish | 0.0 /100 | #309 | Tragic 63.3% |
| Shoshone | 0.0 /100 | #310 | Tragic 63.2% |
| Blackfeet | 0.0 /100 | #311 | Tragic 63.2% |
| Iroquois | 0.0 /100 | #312 | Tragic 63.2% |
Demographics Similar to Lumbee by In Labor Force | Age > 16
In terms of in labor force | age > 16, the demographic groups most similar to Lumbee are Navajo (56.6%, a difference of 0.31%), Tohono O'odham (57.2%, a difference of 0.85%), Pima (57.4%, a difference of 1.1%), Yuman (57.8%, a difference of 1.8%), and Puerto Rican (58.1%, a difference of 2.4%).
| Demographics | Rating | Rank | In Labor Force | Age > 16 |
| Paiute | 0.0 /100 | #333 | Tragic 60.7% |
| Apache | 0.0 /100 | #334 | Tragic 60.7% |
| Natives/Alaskans | 0.0 /100 | #335 | Tragic 60.6% |
| Menominee | 0.0 /100 | #336 | Tragic 60.6% |
| Colville | 0.0 /100 | #337 | Tragic 59.8% |
| Immigrants | Yemen | 0.0 /100 | #338 | Tragic 59.6% |
| Houma | 0.0 /100 | #339 | Tragic 59.5% |
| Pueblo | 0.0 /100 | #340 | Tragic 59.3% |
| Hopi | 0.0 /100 | #341 | Tragic 58.4% |
| Puerto Ricans | 0.0 /100 | #342 | Tragic 58.1% |
| Yuman | 0.0 /100 | #343 | Tragic 57.8% |
| Pima | 0.0 /100 | #344 | Tragic 57.4% |
| Tohono O'odham | 0.0 /100 | #345 | Tragic 57.2% |
| Lumbee | 0.0 /100 | #346 | Tragic 56.8% |
| Navajo | 0.0 /100 | #347 | Tragic 56.6% |