Northern European vs Irish In Labor Force | Age 20-64
COMPARE
Northern European
Irish
In Labor Force | Age 20-64
In Labor Force | Age 20-64 Comparison
Northern Europeans
Irish
79.5%
IN LABOR FORCE | AGE 20-64
34.5/ 100
METRIC RATING
186th/ 347
METRIC RANK
79.3%
IN LABOR FORCE | AGE 20-64
13.2/ 100
METRIC RATING
212th/ 347
METRIC RANK
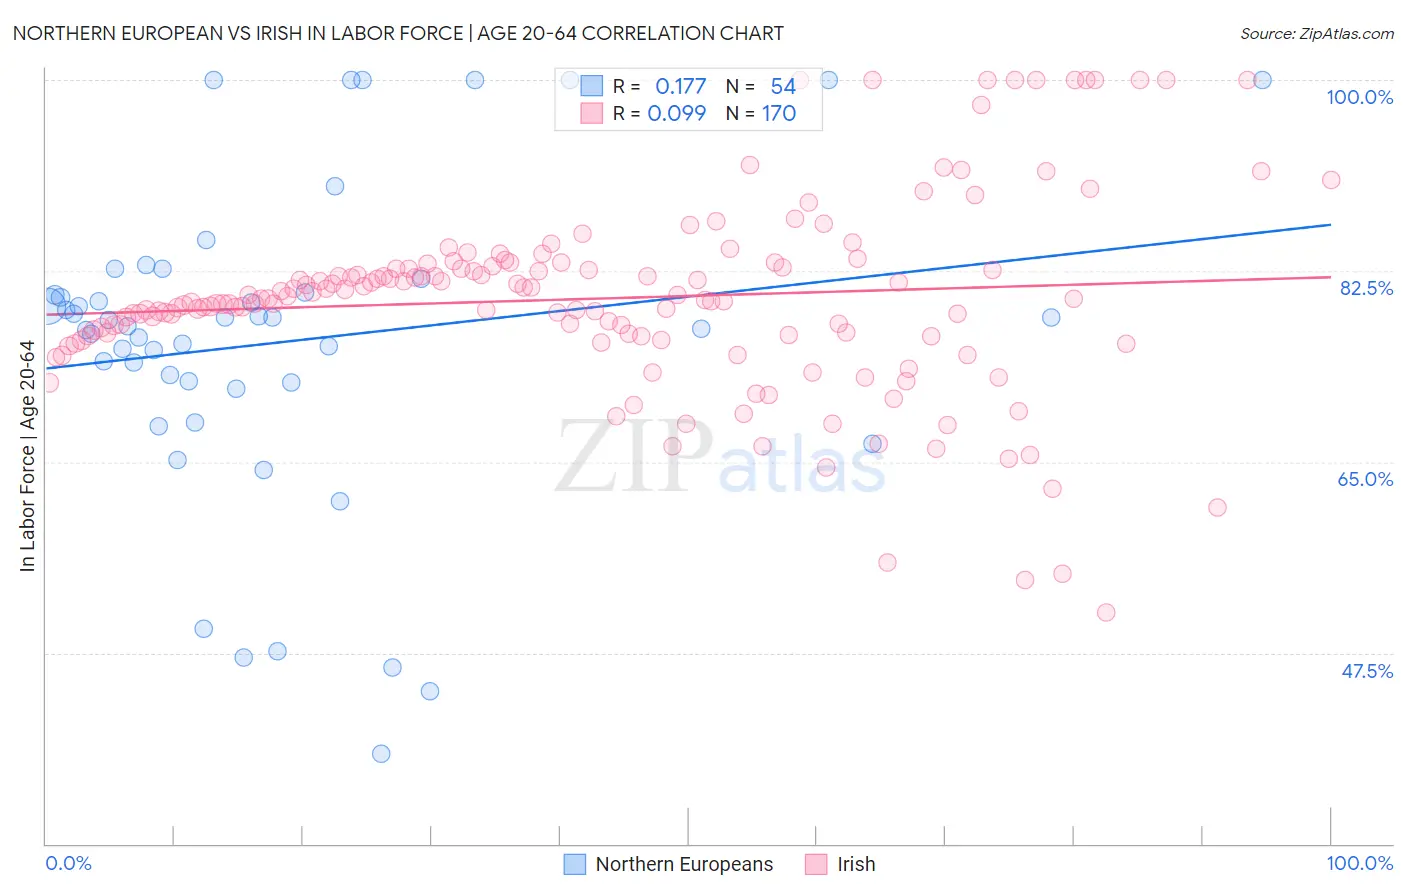
Northern European vs Irish In Labor Force | Age 20-64 Correlation Chart
The statistical analysis conducted on geographies consisting of 406,102,116 people shows a poor positive correlation between the proportion of Northern Europeans and labor force participation rate among population between the ages 20 and 64 in the United States with a correlation coefficient (R) of 0.177 and weighted average of 79.5%. Similarly, the statistical analysis conducted on geographies consisting of 580,689,060 people shows a slight positive correlation between the proportion of Irish and labor force participation rate among population between the ages 20 and 64 in the United States with a correlation coefficient (R) of 0.099 and weighted average of 79.3%, a difference of 0.25%.
In Labor Force | Age 20-64 Correlation Summary
| Measurement | Northern European | Irish |
| Minimum | 38.3% | 51.2% |
| Maximum | 100.0% | 100.0% |
| Range | 61.7% | 48.8% |
| Mean | 76.0% | 80.0% |
| Median | 77.7% | 79.9% |
| Interquartile 25% (IQ1) | 72.3% | 76.5% |
| Interquartile 75% (IQ3) | 80.5% | 82.8% |
| Interquartile Range (IQR) | 8.2% | 6.3% |
| Standard Deviation (Sample) | 14.4% | 8.8% |
| Standard Deviation (Population) | 14.3% | 8.8% |
Similar Demographics by In Labor Force | Age 20-64
Demographics Similar to Northern Europeans by In Labor Force | Age 20-64
In terms of in labor force | age 20-64, the demographic groups most similar to Northern Europeans are Israeli (79.5%, a difference of 0.0%), Finnish (79.5%, a difference of 0.010%), Assyrian/Chaldean/Syriac (79.4%, a difference of 0.010%), Malaysian (79.5%, a difference of 0.020%), and Immigrants from Hungary (79.5%, a difference of 0.020%).
| Demographics | Rating | Rank | In Labor Force | Age 20-64 |
| Armenians | 41.4 /100 | #179 | Average 79.5% |
| Salvadorans | 41.0 /100 | #180 | Average 79.5% |
| Immigrants | Saudi Arabia | 37.7 /100 | #181 | Fair 79.5% |
| Malaysians | 37.1 /100 | #182 | Fair 79.5% |
| Immigrants | Hungary | 36.8 /100 | #183 | Fair 79.5% |
| Finns | 35.9 /100 | #184 | Fair 79.5% |
| Israelis | 34.7 /100 | #185 | Fair 79.5% |
| Northern Europeans | 34.5 /100 | #186 | Fair 79.5% |
| Assyrians/Chaldeans/Syriacs | 33.3 /100 | #187 | Fair 79.4% |
| Immigrants | Haiti | 32.1 /100 | #188 | Fair 79.4% |
| Immigrants | El Salvador | 30.9 /100 | #189 | Fair 79.4% |
| Immigrants | Syria | 30.8 /100 | #190 | Fair 79.4% |
| Swiss | 28.9 /100 | #191 | Fair 79.4% |
| Immigrants | Denmark | 26.9 /100 | #192 | Fair 79.4% |
| Indonesians | 26.1 /100 | #193 | Fair 79.4% |
Demographics Similar to Irish by In Labor Force | Age 20-64
In terms of in labor force | age 20-64, the demographic groups most similar to Irish are Immigrants from Portugal (79.3%, a difference of 0.010%), Immigrants from Armenia (79.2%, a difference of 0.020%), Immigrants from Norway (79.2%, a difference of 0.020%), Arab (79.2%, a difference of 0.030%), and European (79.3%, a difference of 0.040%).
| Demographics | Rating | Rank | In Labor Force | Age 20-64 |
| Immigrants | Congo | 17.5 /100 | #205 | Poor 79.3% |
| Immigrants | Ecuador | 16.9 /100 | #206 | Poor 79.3% |
| Sub-Saharan Africans | 16.5 /100 | #207 | Poor 79.3% |
| British | 16.5 /100 | #208 | Poor 79.3% |
| Bangladeshis | 16.4 /100 | #209 | Poor 79.3% |
| Haitians | 16.1 /100 | #210 | Poor 79.3% |
| Europeans | 15.3 /100 | #211 | Poor 79.3% |
| Irish | 13.2 /100 | #212 | Poor 79.3% |
| Immigrants | Portugal | 12.8 /100 | #213 | Poor 79.3% |
| Immigrants | Armenia | 12.2 /100 | #214 | Poor 79.2% |
| Immigrants | Norway | 12.0 /100 | #215 | Poor 79.2% |
| Arabs | 11.4 /100 | #216 | Poor 79.2% |
| Immigrants | Western Asia | 11.0 /100 | #217 | Poor 79.2% |
| Immigrants | England | 9.3 /100 | #218 | Tragic 79.2% |
| French Canadians | 8.4 /100 | #219 | Tragic 79.2% |