Nigerian vs Immigrants from Dominican Republic In Labor Force | Age 45-54
COMPARE
Nigerian
Immigrants from Dominican Republic
In Labor Force | Age 45-54
In Labor Force | Age 45-54 Comparison
Nigerians
Immigrants from Dominican Republic
82.7%
IN LABOR FORCE | AGE 45-54
40.5/ 100
METRIC RATING
178th/ 347
METRIC RANK
80.1%
IN LABOR FORCE | AGE 45-54
0.0/ 100
METRIC RATING
305th/ 347
METRIC RANK
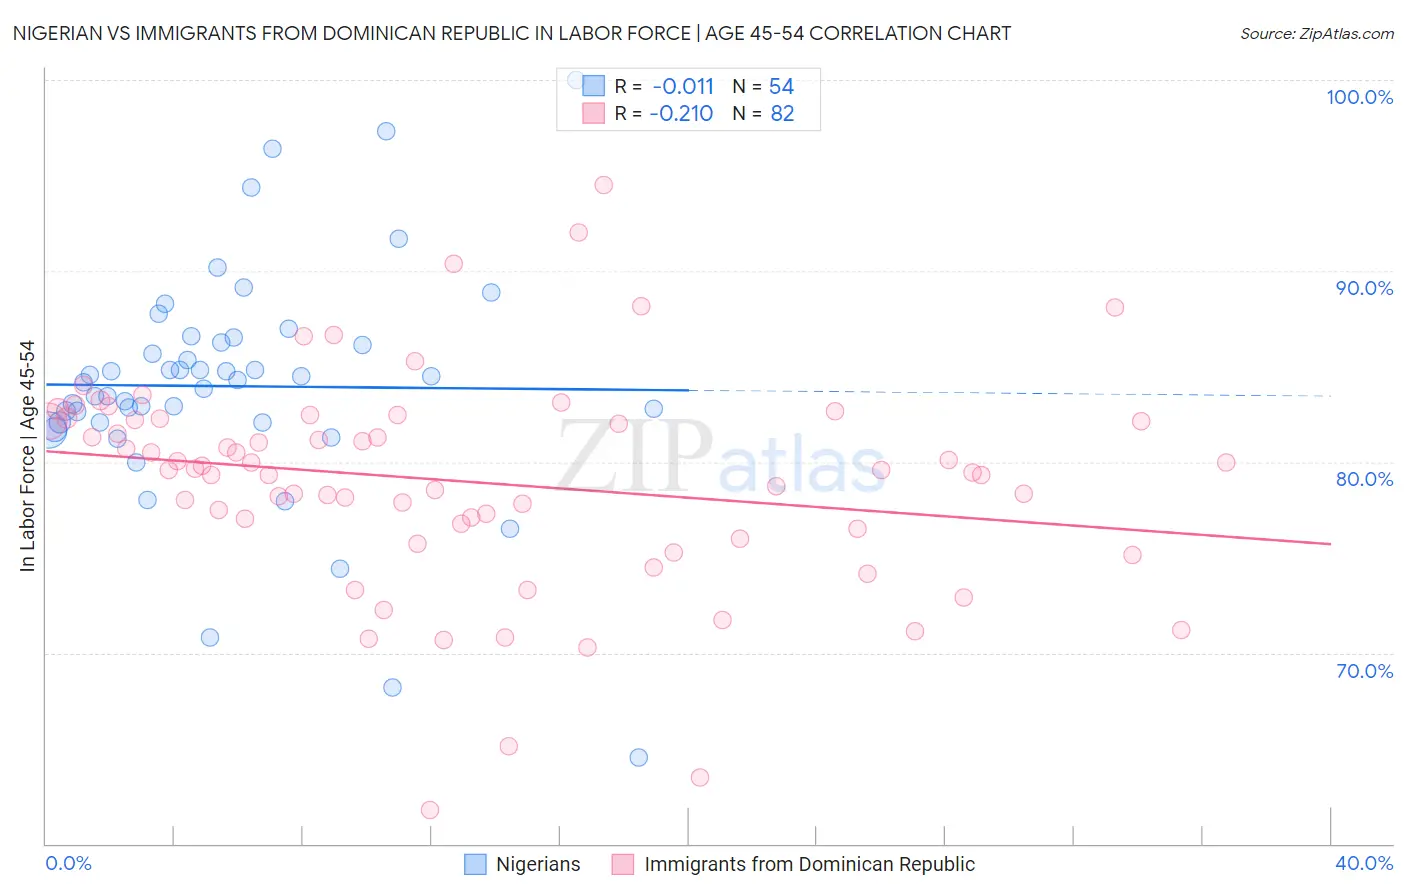
Nigerian vs Immigrants from Dominican Republic In Labor Force | Age 45-54 Correlation Chart
The statistical analysis conducted on geographies consisting of 332,454,323 people shows no correlation between the proportion of Nigerians and labor force participation rate among population between the ages 45 and 54 in the United States with a correlation coefficient (R) of -0.011 and weighted average of 82.7%. Similarly, the statistical analysis conducted on geographies consisting of 274,956,720 people shows a weak negative correlation between the proportion of Immigrants from Dominican Republic and labor force participation rate among population between the ages 45 and 54 in the United States with a correlation coefficient (R) of -0.210 and weighted average of 80.1%, a difference of 3.2%.
In Labor Force | Age 45-54 Correlation Summary
| Measurement | Nigerian | Immigrants from Dominican Republic |
| Minimum | 64.5% | 61.8% |
| Maximum | 100.0% | 94.5% |
| Range | 35.5% | 32.7% |
| Mean | 84.0% | 79.0% |
| Median | 84.2% | 79.6% |
| Interquartile 25% (IQ1) | 82.1% | 76.5% |
| Interquartile 75% (IQ3) | 86.2% | 82.2% |
| Interquartile Range (IQR) | 4.2% | 5.7% |
| Standard Deviation (Sample) | 6.2% | 5.7% |
| Standard Deviation (Population) | 6.1% | 5.6% |
Similar Demographics by In Labor Force | Age 45-54
Demographics Similar to Nigerians by In Labor Force | Age 45-54
In terms of in labor force | age 45-54, the demographic groups most similar to Nigerians are Immigrants from Switzerland (82.7%, a difference of 0.010%), Hungarian (82.7%, a difference of 0.020%), Israeli (82.7%, a difference of 0.030%), Immigrants from Hungary (82.7%, a difference of 0.030%), and Immigrants from Nicaragua (82.7%, a difference of 0.040%).
| Demographics | Rating | Rank | In Labor Force | Age 45-54 |
| Immigrants | Zaire | 52.9 /100 | #171 | Average 82.8% |
| Icelanders | 51.8 /100 | #172 | Average 82.8% |
| Nicaraguans | 50.3 /100 | #173 | Average 82.8% |
| Costa Ricans | 50.0 /100 | #174 | Average 82.8% |
| Immigrants | Liberia | 47.9 /100 | #175 | Average 82.7% |
| Northern Europeans | 46.9 /100 | #176 | Average 82.7% |
| Immigrants | Nicaragua | 44.6 /100 | #177 | Average 82.7% |
| Nigerians | 40.5 /100 | #178 | Average 82.7% |
| Immigrants | Switzerland | 39.4 /100 | #179 | Fair 82.7% |
| Hungarians | 38.0 /100 | #180 | Fair 82.7% |
| Israelis | 37.7 /100 | #181 | Fair 82.7% |
| Immigrants | Hungary | 37.1 /100 | #182 | Fair 82.7% |
| New Zealanders | 32.7 /100 | #183 | Fair 82.6% |
| Europeans | 32.6 /100 | #184 | Fair 82.6% |
| Immigrants | England | 32.2 /100 | #185 | Fair 82.6% |
Demographics Similar to Immigrants from Dominican Republic by In Labor Force | Age 45-54
In terms of in labor force | age 45-54, the demographic groups most similar to Immigrants from Dominican Republic are Hispanic or Latino (80.1%, a difference of 0.010%), Immigrants from the Azores (80.1%, a difference of 0.030%), Spanish American (80.1%, a difference of 0.040%), Immigrants from Central America (80.2%, a difference of 0.090%), and Blackfeet (80.0%, a difference of 0.12%).
| Demographics | Rating | Rank | In Labor Force | Age 45-54 |
| Marshallese | 0.0 /100 | #298 | Tragic 80.3% |
| Dominicans | 0.0 /100 | #299 | Tragic 80.3% |
| Fijians | 0.0 /100 | #300 | Tragic 80.2% |
| Spanish American Indians | 0.0 /100 | #301 | Tragic 80.2% |
| Immigrants | Central America | 0.0 /100 | #302 | Tragic 80.2% |
| Immigrants | Azores | 0.0 /100 | #303 | Tragic 80.1% |
| Hispanics or Latinos | 0.0 /100 | #304 | Tragic 80.1% |
| Immigrants | Dominican Republic | 0.0 /100 | #305 | Tragic 80.1% |
| Spanish Americans | 0.0 /100 | #306 | Tragic 80.1% |
| Blackfeet | 0.0 /100 | #307 | Tragic 80.0% |
| Central American Indians | 0.0 /100 | #308 | Tragic 80.0% |
| Potawatomi | 0.0 /100 | #309 | Tragic 80.0% |
| Inupiat | 0.0 /100 | #310 | Tragic 79.9% |
| Mexicans | 0.0 /100 | #311 | Tragic 79.8% |
| Immigrants | Mexico | 0.0 /100 | #312 | Tragic 79.7% |