Nepalese vs Pakistani In Labor Force | Age 45-54
COMPARE
Nepalese
Pakistani
In Labor Force | Age 45-54
In Labor Force | Age 45-54 Comparison
Nepalese
Pakistanis
80.5%
IN LABOR FORCE | AGE 45-54
0.0/ 100
METRIC RATING
295th/ 347
METRIC RANK
82.8%
IN LABOR FORCE | AGE 45-54
53.2/ 100
METRIC RATING
170th/ 347
METRIC RANK
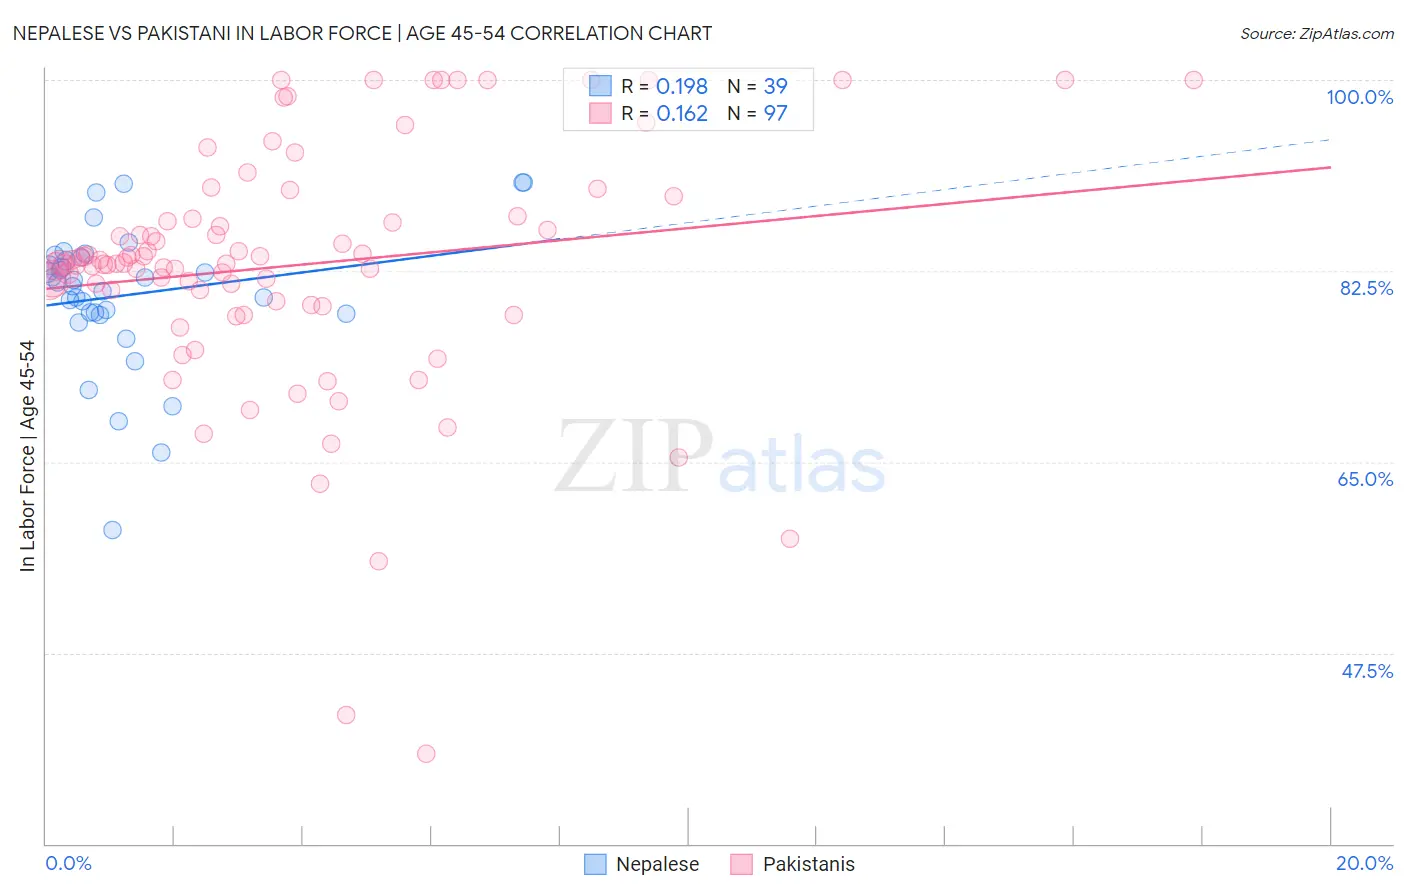
Nepalese vs Pakistani In Labor Force | Age 45-54 Correlation Chart
The statistical analysis conducted on geographies consisting of 24,500,920 people shows a poor positive correlation between the proportion of Nepalese and labor force participation rate among population between the ages 45 and 54 in the United States with a correlation coefficient (R) of 0.198 and weighted average of 80.5%. Similarly, the statistical analysis conducted on geographies consisting of 335,175,573 people shows a poor positive correlation between the proportion of Pakistanis and labor force participation rate among population between the ages 45 and 54 in the United States with a correlation coefficient (R) of 0.162 and weighted average of 82.8%, a difference of 2.8%.
In Labor Force | Age 45-54 Correlation Summary
| Measurement | Nepalese | Pakistani |
| Minimum | 58.7% | 38.2% |
| Maximum | 90.6% | 100.0% |
| Range | 31.9% | 61.8% |
| Mean | 80.3% | 83.0% |
| Median | 81.4% | 83.2% |
| Interquartile 25% (IQ1) | 78.6% | 79.5% |
| Interquartile 75% (IQ3) | 83.7% | 87.4% |
| Interquartile Range (IQR) | 5.1% | 7.9% |
| Standard Deviation (Sample) | 6.6% | 11.4% |
| Standard Deviation (Population) | 6.5% | 11.3% |
Similar Demographics by In Labor Force | Age 45-54
Demographics Similar to Nepalese by In Labor Force | Age 45-54
In terms of in labor force | age 45-54, the demographic groups most similar to Nepalese are African (80.5%, a difference of 0.040%), Osage (80.6%, a difference of 0.070%), Yakama (80.6%, a difference of 0.070%), Iroquois (80.6%, a difference of 0.090%), and Immigrants from Belize (80.6%, a difference of 0.12%).
| Demographics | Rating | Rank | In Labor Force | Age 45-54 |
| Cree | 0.0 /100 | #288 | Tragic 80.8% |
| Immigrants | Bangladesh | 0.0 /100 | #289 | Tragic 80.7% |
| Mexican American Indians | 0.0 /100 | #290 | Tragic 80.7% |
| Immigrants | Belize | 0.0 /100 | #291 | Tragic 80.6% |
| Iroquois | 0.0 /100 | #292 | Tragic 80.6% |
| Osage | 0.0 /100 | #293 | Tragic 80.6% |
| Yakama | 0.0 /100 | #294 | Tragic 80.6% |
| Nepalese | 0.0 /100 | #295 | Tragic 80.5% |
| Africans | 0.0 /100 | #296 | Tragic 80.5% |
| Americans | 0.0 /100 | #297 | Tragic 80.4% |
| Marshallese | 0.0 /100 | #298 | Tragic 80.3% |
| Dominicans | 0.0 /100 | #299 | Tragic 80.3% |
| Fijians | 0.0 /100 | #300 | Tragic 80.2% |
| Spanish American Indians | 0.0 /100 | #301 | Tragic 80.2% |
| Immigrants | Central America | 0.0 /100 | #302 | Tragic 80.2% |
Demographics Similar to Pakistanis by In Labor Force | Age 45-54
In terms of in labor force | age 45-54, the demographic groups most similar to Pakistanis are Immigrants from Zaire (82.8%, a difference of 0.0%), Immigrants from Western Africa (82.8%, a difference of 0.010%), Icelander (82.8%, a difference of 0.010%), Immigrants from South Africa (82.8%, a difference of 0.020%), and Swiss (82.8%, a difference of 0.030%).
| Demographics | Rating | Rank | In Labor Force | Age 45-54 |
| Dutch | 61.7 /100 | #163 | Good 82.8% |
| German Russians | 61.3 /100 | #164 | Good 82.8% |
| Immigrants | Sudan | 59.9 /100 | #165 | Average 82.8% |
| Immigrants | South Eastern Asia | 57.4 /100 | #166 | Average 82.8% |
| Swiss | 56.5 /100 | #167 | Average 82.8% |
| Immigrants | South Africa | 55.8 /100 | #168 | Average 82.8% |
| Immigrants | Western Africa | 54.1 /100 | #169 | Average 82.8% |
| Pakistanis | 53.2 /100 | #170 | Average 82.8% |
| Immigrants | Zaire | 52.9 /100 | #171 | Average 82.8% |
| Icelanders | 51.8 /100 | #172 | Average 82.8% |
| Nicaraguans | 50.3 /100 | #173 | Average 82.8% |
| Costa Ricans | 50.0 /100 | #174 | Average 82.8% |
| Immigrants | Liberia | 47.9 /100 | #175 | Average 82.7% |
| Northern Europeans | 46.9 /100 | #176 | Average 82.7% |
| Immigrants | Nicaragua | 44.6 /100 | #177 | Average 82.7% |