Mexican American Indian vs Immigrants from Mexico In Labor Force | Age 45-54
COMPARE
Mexican American Indian
Immigrants from Mexico
In Labor Force | Age 45-54
In Labor Force | Age 45-54 Comparison
Mexican American Indians
Immigrants from Mexico
80.7%
IN LABOR FORCE | AGE 45-54
0.0/ 100
METRIC RATING
290th/ 347
METRIC RANK
79.7%
IN LABOR FORCE | AGE 45-54
0.0/ 100
METRIC RATING
312th/ 347
METRIC RANK
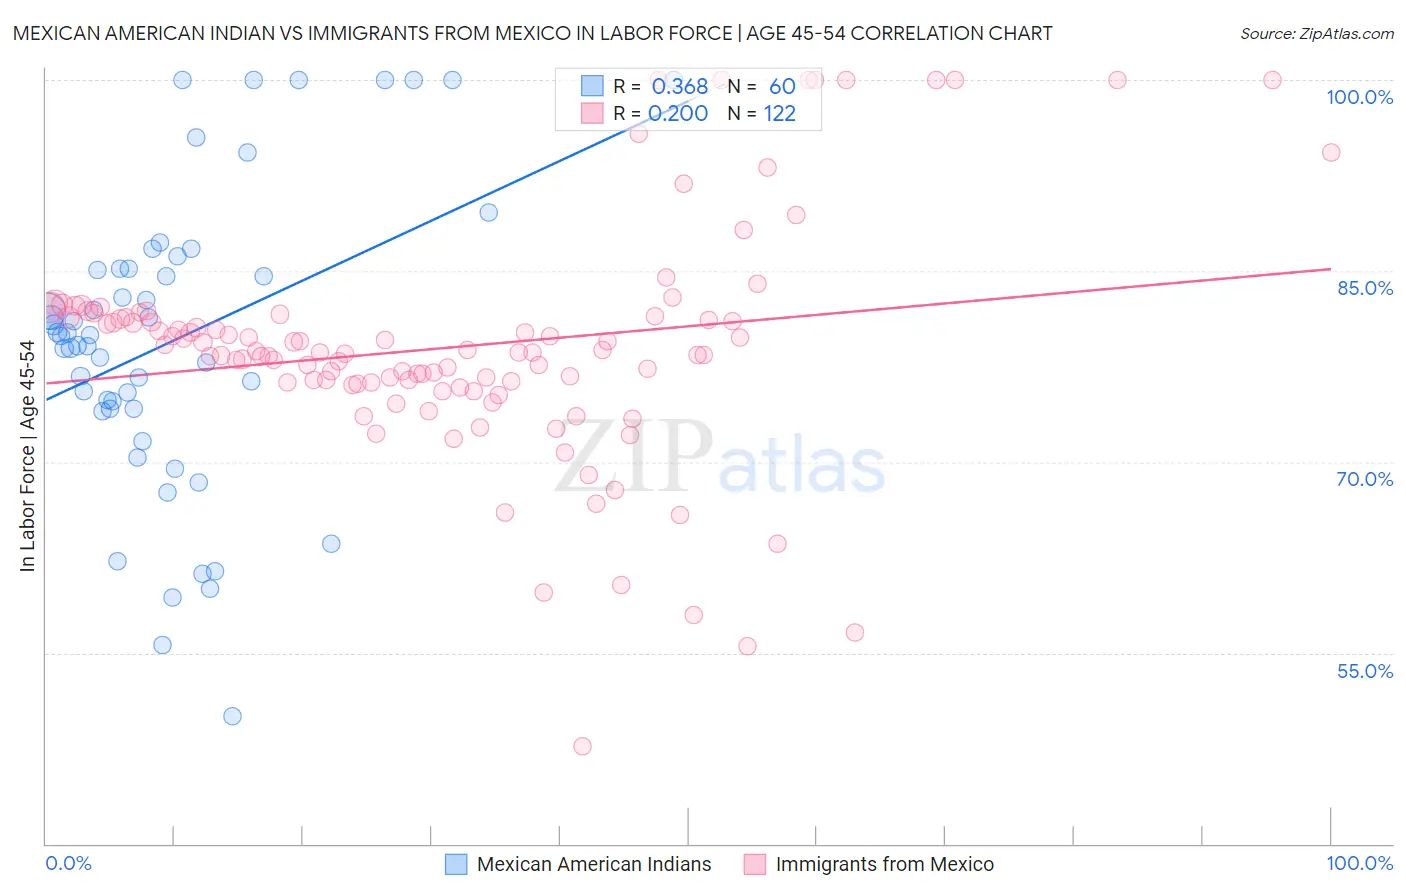
Mexican American Indian vs Immigrants from Mexico In Labor Force | Age 45-54 Correlation Chart
The statistical analysis conducted on geographies consisting of 317,497,854 people shows a mild positive correlation between the proportion of Mexican American Indians and labor force participation rate among population between the ages 45 and 54 in the United States with a correlation coefficient (R) of 0.368 and weighted average of 80.7%. Similarly, the statistical analysis conducted on geographies consisting of 513,319,268 people shows a poor positive correlation between the proportion of Immigrants from Mexico and labor force participation rate among population between the ages 45 and 54 in the United States with a correlation coefficient (R) of 0.200 and weighted average of 79.7%, a difference of 1.3%.
In Labor Force | Age 45-54 Correlation Summary
| Measurement | Mexican American Indian | Immigrants from Mexico |
| Minimum | 50.0% | 47.6% |
| Maximum | 100.0% | 100.0% |
| Range | 50.0% | 52.4% |
| Mean | 79.5% | 79.0% |
| Median | 80.0% | 78.6% |
| Interquartile 25% (IQ1) | 74.2% | 76.2% |
| Interquartile 75% (IQ3) | 85.1% | 81.4% |
| Interquartile Range (IQR) | 11.0% | 5.2% |
| Standard Deviation (Sample) | 11.7% | 9.1% |
| Standard Deviation (Population) | 11.6% | 9.1% |
Similar Demographics by In Labor Force | Age 45-54
Demographics Similar to Mexican American Indians by In Labor Force | Age 45-54
In terms of in labor force | age 45-54, the demographic groups most similar to Mexican American Indians are Immigrants from Bangladesh (80.7%, a difference of 0.030%), Cree (80.8%, a difference of 0.060%), Delaware (80.8%, a difference of 0.070%), Immigrants from Dominica (80.8%, a difference of 0.070%), and Vietnamese (80.8%, a difference of 0.070%).
| Demographics | Rating | Rank | In Labor Force | Age 45-54 |
| French American Indians | 0.0 /100 | #283 | Tragic 80.8% |
| Belizeans | 0.0 /100 | #284 | Tragic 80.8% |
| Delaware | 0.0 /100 | #285 | Tragic 80.8% |
| Immigrants | Dominica | 0.0 /100 | #286 | Tragic 80.8% |
| Vietnamese | 0.0 /100 | #287 | Tragic 80.8% |
| Cree | 0.0 /100 | #288 | Tragic 80.8% |
| Immigrants | Bangladesh | 0.0 /100 | #289 | Tragic 80.7% |
| Mexican American Indians | 0.0 /100 | #290 | Tragic 80.7% |
| Immigrants | Belize | 0.0 /100 | #291 | Tragic 80.6% |
| Iroquois | 0.0 /100 | #292 | Tragic 80.6% |
| Osage | 0.0 /100 | #293 | Tragic 80.6% |
| Yakama | 0.0 /100 | #294 | Tragic 80.6% |
| Nepalese | 0.0 /100 | #295 | Tragic 80.5% |
| Africans | 0.0 /100 | #296 | Tragic 80.5% |
| Americans | 0.0 /100 | #297 | Tragic 80.4% |
Demographics Similar to Immigrants from Mexico by In Labor Force | Age 45-54
In terms of in labor force | age 45-54, the demographic groups most similar to Immigrants from Mexico are Mexican (79.8%, a difference of 0.14%), Colville (79.5%, a difference of 0.24%), Inupiat (79.9%, a difference of 0.25%), Ottawa (79.5%, a difference of 0.28%), and Potawatomi (80.0%, a difference of 0.34%).
| Demographics | Rating | Rank | In Labor Force | Age 45-54 |
| Immigrants | Dominican Republic | 0.0 /100 | #305 | Tragic 80.1% |
| Spanish Americans | 0.0 /100 | #306 | Tragic 80.1% |
| Blackfeet | 0.0 /100 | #307 | Tragic 80.0% |
| Central American Indians | 0.0 /100 | #308 | Tragic 80.0% |
| Potawatomi | 0.0 /100 | #309 | Tragic 80.0% |
| Inupiat | 0.0 /100 | #310 | Tragic 79.9% |
| Mexicans | 0.0 /100 | #311 | Tragic 79.8% |
| Immigrants | Mexico | 0.0 /100 | #312 | Tragic 79.7% |
| Colville | 0.0 /100 | #313 | Tragic 79.5% |
| Ottawa | 0.0 /100 | #314 | Tragic 79.5% |
| Blacks/African Americans | 0.0 /100 | #315 | Tragic 79.3% |
| Shoshone | 0.0 /100 | #316 | Tragic 79.3% |
| Comanche | 0.0 /100 | #317 | Tragic 79.2% |
| Chickasaw | 0.0 /100 | #318 | Tragic 79.0% |
| Cherokee | 0.0 /100 | #319 | Tragic 79.0% |