Marshallese vs Immigrants from the Azores In Labor Force | Age 35-44

COMPARE

Marshallese
Race
Ancestry
AfghanAfricanAlaska NativeAlaskan AthabascanAlbanianAleutAlsatianAmericanApacheArabArapahoArgentineanArmenianAssyrian/Chaldean/SyriacAustralianAustrianBahamianBangladeshiBarbadianBasqueBelgianBelizeanBermudanBhutaneseBlackfeetBolivianBrazilianBritishBritish West IndianBulgarianBurmeseCajunCambodianCanadianCape VerdeanCarpatho RusynCelticCentral AmericanCentral American IndianCherokeeCheyenneChickasawChileanChineseChippewaChoctawColombianColvilleComancheCosta RicanCreeCreekCroatianCrowCubanCypriotCzechCzechoslovakianDanishDelawareDominicanDutchDutch West IndianEastern EuropeanEcuadorianEgyptianEnglishEstonianEthiopianEuropeanFijianFilipinoFinnishFrenchFrench American IndianFrench CanadianGermanGerman RussianGhanaianGreekGuamanian/ChamorroGuatemalanGuyaneseHaitianHmongHonduranHopiHoumaHungarianIcelanderIndian (Asian)IndonesianInupiatIranianIraqiIrishIroquoisIsraeliItalianJamaicanJapaneseJordanianKenyanKiowaKoreanLaotianLatvianLebaneseLiberianLithuanianLumbeeLuxembourgerMacedonianMalaysianMalteseMarshalleseMenomineeMexicanMexican American IndianMongolianMoroccanNative HawaiianNavajoNepaleseNew ZealanderNicaraguanNigerianNorthern EuropeanNorwegianOkinawanOsageOttawaPaiutePakistaniPalestinianPanamanianParaguayanPennsylvania GermanPeruvianPimaPolishPortuguesePotawatomiPuebloPuerto RicanPuget Sound SalishRomanianRussianSalvadoranSamoanScandinavianScotch-IrishScottishSeminoleSenegaleseSerbianShoshoneSierra LeoneanSiouxSlavicSlovakSloveneSomaliSouth AfricanSouth AmericanSouth American IndianSoviet UnionSpaniardSpanishSpanish AmericanSpanish American IndianSri LankanSubsaharan AfricanSudaneseSwedishSwissSyrianTaiwaneseThaiTlingit-HaidaTohono O'OdhamTonganTrinidadian and TobagonianTsimshianTurkishU.S. Virgin IslanderUgandanUkrainianUruguayanUteVenezuelanVietnameseWelshWest IndianYakamaYaquiYugoslavianYumanYup'ikZimbabwean
Immigration
NonimmigrantsImmigrantsAfghanistanAfricaAlbaniaArgentinaArmeniaAsiaAustraliaAustriaBahamasBangladeshBarbadosBelarusBelgiumBelizeBoliviaBosnia and HerzegovinaBrazilBulgariaBurma/MyanmarCabo VerdeCambodiaCameroonCanadaCaribbeanCentral AmericaChileChinaColombiaCongoCosta RicaCroatiaCubaCzechoslovakiaDenmarkDominicaDominican RepublicEastern AfricaEastern AsiaEastern EuropeEcuadorEgyptEl SalvadorEnglandEritreaEthiopiaEuropeFijiFranceGermanyGhanaGreeceGrenadaGuatemalaGuyanaHaitiHondurasHong KongHungaryIndiaIndonesiaIranIraqIrelandIsraelItalyJamaicaJapanJordanKazakhstanKenyaKoreaKuwaitLaosLatin AmericaLatviaLebanonLiberiaLithuaniaMalaysiaMexicoMicronesiaMiddle AfricaMoldovaMoroccoNepalNetherlandsNicaraguaNigeriaNorth AmericaNorth MacedoniaNorthern AfricaNorthern EuropeNorwayOceaniaPakistanPanamaPeruPhilippinesPolandPortugalRomaniaRussiaSaudi ArabiaScotlandSenegalSerbiaSierra LeoneSingaporeSomaliaSouth AfricaSouth AmericaSouth Central AsiaSouth Eastern AsiaSouthern EuropeSpainSri LankaSt. Vincent and the GrenadinesSudanSwedenSwitzerlandSyriaTaiwanThailandTrinidad and TobagoTurkeyUgandaUkraineUruguayUzbekistanVenezuelaVietnamWest IndiesWestern AfricaWestern AsiaWestern EuropeYemenZaireZimbabwe
Immigrants from the Azores
Race
Ancestry
AfghanAfricanAlaska NativeAlaskan AthabascanAlbanianAleutAlsatianAmericanApacheArabArapahoArgentineanArmenianAssyrian/Chaldean/SyriacAustralianAustrianBahamianBangladeshiBarbadianBasqueBelgianBelizeanBermudanBhutaneseBlackfeetBolivianBrazilianBritishBritish West IndianBulgarianBurmeseCajunCambodianCanadianCape VerdeanCarpatho RusynCelticCentral AmericanCentral American IndianCherokeeCheyenneChickasawChileanChineseChippewaChoctawColombianColvilleComancheCosta RicanCreeCreekCroatianCrowCubanCypriotCzechCzechoslovakianDanishDelawareDominicanDutchDutch West IndianEastern EuropeanEcuadorianEgyptianEnglishEstonianEthiopianEuropeanFijianFilipinoFinnishFrenchFrench American IndianFrench CanadianGermanGerman RussianGhanaianGreekGuamanian/ChamorroGuatemalanGuyaneseHaitianHmongHonduranHopiHoumaHungarianIcelanderIndian (Asian)IndonesianInupiatIranianIraqiIrishIroquoisIsraeliItalianJamaicanJapaneseJordanianKenyanKiowaKoreanLaotianLatvianLebaneseLiberianLithuanianLumbeeLuxembourgerMacedonianMalaysianMalteseMenomineeMexicanMexican American IndianMongolianMoroccanNative HawaiianNavajoNepaleseNew ZealanderNicaraguanNigerianNorthern EuropeanNorwegianOkinawanOsageOttawaPaiutePakistaniPalestinianPanamanianParaguayanPennsylvania GermanPeruvianPimaPolishPortuguesePotawatomiPuebloPuerto RicanPuget Sound SalishRomanianRussianSalvadoranSamoanScandinavianScotch-IrishScottishSeminoleSenegaleseSerbianShoshoneSierra LeoneanSiouxSlavicSlovakSloveneSomaliSouth AfricanSouth AmericanSouth American IndianSoviet UnionSpaniardSpanishSpanish AmericanSpanish American IndianSri LankanSubsaharan AfricanSudaneseSwedishSwissSyrianTaiwaneseThaiTlingit-HaidaTohono O'OdhamTonganTrinidadian and TobagonianTsimshianTurkishU.S. Virgin IslanderUgandanUkrainianUruguayanUteVenezuelanVietnameseWelshWest IndianYakamaYaquiYugoslavianYumanYup'ikZimbabwean
Immigration
NonimmigrantsImmigrantsAfghanistanAfricaAlbaniaArgentinaArmeniaAsiaAustraliaAustriaBahamasBangladeshBarbadosBelarusBelgiumBelizeBoliviaBosnia and HerzegovinaBrazilBulgariaBurma/MyanmarCabo VerdeCambodiaCameroonCanadaCaribbeanCentral AmericaChileChinaColombiaCongoCosta RicaCroatiaCubaCzechoslovakiaDenmarkDominicaDominican RepublicEastern AfricaEastern AsiaEastern EuropeEcuadorEgyptEl SalvadorEnglandEritreaEthiopiaEuropeFijiFranceGermanyGhanaGreeceGrenadaGuatemalaGuyanaHaitiHondurasHong KongHungaryIndiaIndonesiaIranIraqIrelandIsraelItalyJamaicaJapanJordanKazakhstanKenyaKoreaKuwaitLaosLatin AmericaLatviaLebanonLiberiaLithuaniaMalaysiaMexicoMicronesiaMiddle AfricaMoldovaMoroccoNepalNetherlandsNicaraguaNigeriaNorth AmericaNorth MacedoniaNorthern AfricaNorthern EuropeNorwayOceaniaPakistanPanamaPeruPhilippinesPolandPortugalRomaniaRussiaSaudi ArabiaScotlandSenegalSerbiaSierra LeoneSingaporeSomaliaSouth AfricaSouth AmericaSouth Central AsiaSouth Eastern AsiaSouthern EuropeSpainSri LankaSt. Vincent and the GrenadinesSudanSwedenSwitzerlandSyriaTaiwanThailandTrinidad and TobagoTurkeyUgandaUkraineUruguayUzbekistanVenezuelaVietnamWest IndiesWestern AfricaWestern AsiaWestern EuropeYemenZaireZimbabweAzores
In Labor Force | Age 35-44
Income
Poverty
Unemployment
Labor Participation
Family Structure
Vehicle Availability
Education Level
Disability

In Labor Force | Age 35-44 Comparison

Marshallese

Immigrants from the Azores

Tragic
Tragic
82.4%
IN LABOR FORCE | AGE 35-44
0.0/ 100
METRIC RATING
304th/ 347
METRIC RANK
83.6%
IN LABOR FORCE | AGE 35-44
0.3/ 100
METRIC RATING
255th/ 347
METRIC RANK

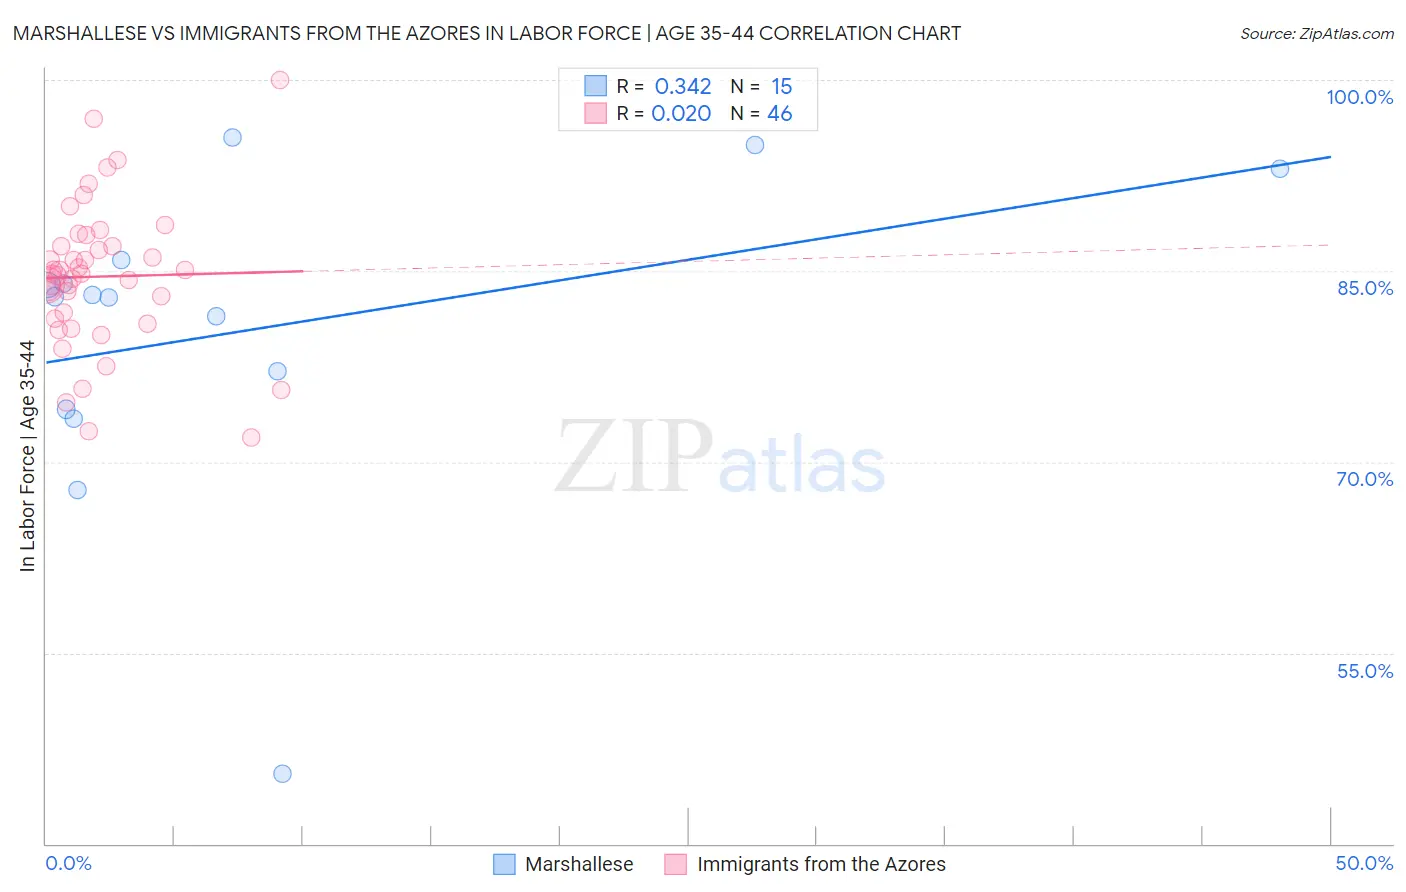
Marshallese vs Immigrants from the Azores In Labor Force | Age 35-44 Correlation Chart

The statistical analysis conducted on geographies consisting of 14,760,991 people shows a mild positive correlation between the proportion of Marshallese and labor force participation rate among population between the ages 35 and 44 in the United States with a correlation coefficient (R) of 0.342 and weighted average of 82.4%. Similarly, the statistical analysis conducted on geographies consisting of 46,255,130 people shows no correlation between the proportion of Immigrants from the Azores and labor force participation rate among population between the ages 35 and 44 in the United States with a correlation coefficient (R) of 0.020 and weighted average of 83.6%, a difference of 1.4%.
Marshallese vs Immigrants from the Azores In Labor Force | Age 35-44

In Labor Force | Age 35-44 Correlation Summary

MeasurementMarshalleseImmigrants from the Azores
Minimum45.5%71.9%
Maximum95.5%100.0%
Range50.0%28.1%
Mean80.4%84.6%
Median83.0%84.8%
Interquartile 25% (IQ1)74.1%81.3%
Interquartile 75% (IQ3)85.9%86.9%
Interquartile Range (IQR)11.8%5.6%
Standard Deviation (Sample)12.4%5.8%
Standard Deviation (Population)12.0%5.7%

Similar Demographics by In Labor Force | Age 35-44

Demographics Similar to Marshallese by In Labor Force | Age 35-44

In terms of in labor force | age 35-44, the demographic groups most similar to Marshallese are American (82.4%, a difference of 0.010%), Nepalese (82.4%, a difference of 0.010%), Spanish American Indian (82.5%, a difference of 0.080%), Central American Indian (82.5%, a difference of 0.11%), and Tlingit-Haida (82.5%, a difference of 0.17%).
DemographicsRating | RankIn Labor Force | Age 35-44
Hmong
0.0
/100
|
#297
Tragic
82.6%
Ottawa
0.0
/100
|
#298
Tragic
82.6%
Tlingit-Haida
0.0
/100
|
#299
Tragic
82.5%
Central American Indians
0.0
/100
|
#300
Tragic
82.5%
Spanish American Indians
0.0
/100
|
#301
Tragic
82.5%
Americans
0.0
/100
|
#302
Tragic
82.4%
Nepalese
0.0
/100
|
#303
Tragic
82.4%
Marshallese
0.0
/100
|
#304
Tragic
82.4%
Shoshone
0.0
/100
|
#305
Tragic
82.2%
Blacks/African Americans
0.0
/100
|
#306
Tragic
82.2%
Hispanics or Latinos
0.0
/100
|
#307
Tragic
82.1%
Immigrants | Central America
0.0
/100
|
#308
Tragic
82.0%
Cree
0.0
/100
|
#309
Tragic
82.0%
Blackfeet
0.0
/100
|
#310
Tragic
81.9%
Colville
0.0
/100
|
#311
Tragic
81.7%

Demographics Similar to Immigrants from the Azores by In Labor Force | Age 35-44

In terms of in labor force | age 35-44, the demographic groups most similar to Immigrants from the Azores are Japanese (83.6%, a difference of 0.020%), Tongan (83.6%, a difference of 0.030%), Basque (83.6%, a difference of 0.030%), Salvadoran (83.6%, a difference of 0.040%), and Immigrants from Guyana (83.6%, a difference of 0.040%).
DemographicsRating | RankIn Labor Force | Age 35-44
Indonesians
0.8
/100
|
#248
Tragic
83.7%
Immigrants | St. Vincent and the Grenadines
0.7
/100
|
#249
Tragic
83.7%
Whites/Caucasians
0.5
/100
|
#250
Tragic
83.6%
Salvadorans
0.4
/100
|
#251
Tragic
83.6%
Immigrants | Guyana
0.4
/100
|
#252
Tragic
83.6%
Lebanese
0.4
/100
|
#253
Tragic
83.6%
Tongans
0.4
/100
|
#254
Tragic
83.6%
Immigrants | Azores
0.3
/100
|
#255
Tragic
83.6%
Japanese
0.3
/100
|
#256
Tragic
83.6%
Basques
0.3
/100
|
#257
Tragic
83.6%
Tsimshian
0.2
/100
|
#258
Tragic
83.5%
Immigrants | El Salvador
0.2
/100
|
#259
Tragic
83.5%
Vietnamese
0.2
/100
|
#260
Tragic
83.5%
Immigrants | Dominica
0.2
/100
|
#261
Tragic
83.5%
Immigrants | Congo
0.2
/100
|
#262
Tragic
83.5%