Macedonian vs Yuman In Labor Force | Age 20-24

COMPARE

Macedonian
Race
Ancestry
AfghanAfricanAlaska NativeAlaskan AthabascanAlbanianAleutAlsatianAmericanApacheArabArapahoArgentineanArmenianAssyrian/Chaldean/SyriacAustralianAustrianBahamianBangladeshiBarbadianBasqueBelgianBelizeanBermudanBhutaneseBlackfeetBolivianBrazilianBritishBritish West IndianBulgarianBurmeseCajunCambodianCanadianCape VerdeanCarpatho RusynCelticCentral AmericanCentral American IndianCherokeeCheyenneChickasawChileanChineseChippewaChoctawColombianColvilleComancheCosta RicanCreeCreekCroatianCrowCubanCypriotCzechCzechoslovakianDanishDelawareDominicanDutchDutch West IndianEastern EuropeanEcuadorianEgyptianEnglishEstonianEthiopianEuropeanFijianFilipinoFinnishFrenchFrench American IndianFrench CanadianGermanGerman RussianGhanaianGreekGuamanian/ChamorroGuatemalanGuyaneseHaitianHmongHonduranHopiHoumaHungarianIcelanderIndian (Asian)IndonesianInupiatIranianIraqiIrishIroquoisIsraeliItalianJamaicanJapaneseJordanianKenyanKiowaKoreanLaotianLatvianLebaneseLiberianLithuanianLumbeeLuxembourgerMacedonianMalaysianMalteseMarshalleseMenomineeMexicanMexican American IndianMongolianMoroccanNative HawaiianNavajoNepaleseNew ZealanderNicaraguanNigerianNorthern EuropeanNorwegianOkinawanOsageOttawaPaiutePakistaniPalestinianPanamanianParaguayanPennsylvania GermanPeruvianPimaPolishPortuguesePotawatomiPuebloPuerto RicanPuget Sound SalishRomanianRussianSalvadoranSamoanScandinavianScotch-IrishScottishSeminoleSenegaleseSerbianShoshoneSierra LeoneanSiouxSlavicSlovakSloveneSomaliSouth AfricanSouth AmericanSouth American IndianSoviet UnionSpaniardSpanishSpanish AmericanSpanish American IndianSri LankanSubsaharan AfricanSudaneseSwedishSwissSyrianTaiwaneseThaiTlingit-HaidaTohono O'OdhamTonganTrinidadian and TobagonianTsimshianTurkishU.S. Virgin IslanderUgandanUkrainianUruguayanUteVenezuelanVietnameseWelshWest IndianYakamaYaquiYugoslavianYup'ikZimbabwean
Immigration
NonimmigrantsImmigrantsAfghanistanAfricaAlbaniaArgentinaArmeniaAsiaAustraliaAustriaBahamasBangladeshBarbadosBelarusBelgiumBelizeBoliviaBosnia and HerzegovinaBrazilBulgariaBurma/MyanmarCabo VerdeCambodiaCameroonCanadaCaribbeanCentral AmericaChileChinaColombiaCongoCosta RicaCroatiaCubaCzechoslovakiaDenmarkDominicaDominican RepublicEastern AfricaEastern AsiaEastern EuropeEcuadorEgyptEl SalvadorEnglandEritreaEthiopiaEuropeFijiFranceGermanyGhanaGreeceGrenadaGuatemalaGuyanaHaitiHondurasHong KongHungaryIndiaIndonesiaIranIraqIrelandIsraelItalyJamaicaJapanJordanKazakhstanKenyaKoreaKuwaitLaosLatin AmericaLatviaLebanonLiberiaLithuaniaMalaysiaMexicoMicronesiaMiddle AfricaMoldovaMoroccoNepalNetherlandsNicaraguaNigeriaNorth AmericaNorth MacedoniaNorthern AfricaNorthern EuropeNorwayOceaniaPakistanPanamaPeruPhilippinesPolandPortugalRomaniaRussiaSaudi ArabiaScotlandSenegalSerbiaSierra LeoneSingaporeSomaliaSouth AfricaSouth AmericaSouth Central AsiaSouth Eastern AsiaSouthern EuropeSpainSri LankaSt. Vincent and the GrenadinesSudanSwedenSwitzerlandSyriaTaiwanThailandTrinidad and TobagoTurkeyUgandaUkraineUruguayUzbekistanVenezuelaVietnamWest IndiesWestern AfricaWestern AsiaWestern EuropeYemenZaireZimbabweAzores
Yuman
Race
Ancestry
AfghanAfricanAlaska NativeAlaskan AthabascanAlbanianAleutAlsatianAmericanApacheArabArapahoArgentineanArmenianAssyrian/Chaldean/SyriacAustralianAustrianBahamianBangladeshiBarbadianBasqueBelgianBelizeanBermudanBhutaneseBlackfeetBolivianBrazilianBritishBritish West IndianBulgarianBurmeseCajunCambodianCanadianCape VerdeanCarpatho RusynCelticCentral AmericanCentral American IndianCherokeeCheyenneChickasawChileanChineseChippewaChoctawColombianColvilleComancheCosta RicanCreeCreekCroatianCrowCubanCypriotCzechCzechoslovakianDanishDelawareDominicanDutchDutch West IndianEastern EuropeanEcuadorianEgyptianEnglishEstonianEthiopianEuropeanFijianFilipinoFinnishFrenchFrench American IndianFrench CanadianGermanGerman RussianGhanaianGreekGuamanian/ChamorroGuatemalanGuyaneseHaitianHmongHonduranHopiHoumaHungarianIcelanderIndian (Asian)IndonesianInupiatIranianIraqiIrishIroquoisIsraeliItalianJamaicanJapaneseJordanianKenyanKiowaKoreanLaotianLatvianLebaneseLiberianLithuanianLumbeeLuxembourgerMalaysianMalteseMarshalleseMenomineeMexicanMexican American IndianMongolianMoroccanNative HawaiianNavajoNepaleseNew ZealanderNicaraguanNigerianNorthern EuropeanNorwegianOkinawanOsageOttawaPaiutePakistaniPalestinianPanamanianParaguayanPennsylvania GermanPeruvianPimaPolishPortuguesePotawatomiPuebloPuerto RicanPuget Sound SalishRomanianRussianSalvadoranSamoanScandinavianScotch-IrishScottishSeminoleSenegaleseSerbianShoshoneSierra LeoneanSiouxSlavicSlovakSloveneSomaliSouth AfricanSouth AmericanSouth American IndianSoviet UnionSpaniardSpanishSpanish AmericanSpanish American IndianSri LankanSubsaharan AfricanSudaneseSwedishSwissSyrianTaiwaneseThaiTlingit-HaidaTohono O'OdhamTonganTrinidadian and TobagonianTsimshianTurkishU.S. Virgin IslanderUgandanUkrainianUruguayanUteVenezuelanVietnameseWelshWest IndianYakamaYaquiYugoslavianYumanYup'ikZimbabwean
Immigration
NonimmigrantsImmigrantsAfghanistanAfricaAlbaniaArgentinaArmeniaAsiaAustraliaAustriaBahamasBangladeshBarbadosBelarusBelgiumBelizeBoliviaBosnia and HerzegovinaBrazilBulgariaBurma/MyanmarCabo VerdeCambodiaCameroonCanadaCaribbeanCentral AmericaChileChinaColombiaCongoCosta RicaCroatiaCubaCzechoslovakiaDenmarkDominicaDominican RepublicEastern AfricaEastern AsiaEastern EuropeEcuadorEgyptEl SalvadorEnglandEritreaEthiopiaEuropeFijiFranceGermanyGhanaGreeceGrenadaGuatemalaGuyanaHaitiHondurasHong KongHungaryIndiaIndonesiaIranIraqIrelandIsraelItalyJamaicaJapanJordanKazakhstanKenyaKoreaKuwaitLaosLatin AmericaLatviaLebanonLiberiaLithuaniaMalaysiaMexicoMicronesiaMiddle AfricaMoldovaMoroccoNepalNetherlandsNicaraguaNigeriaNorth AmericaNorth MacedoniaNorthern AfricaNorthern EuropeNorwayOceaniaPakistanPanamaPeruPhilippinesPolandPortugalRomaniaRussiaSaudi ArabiaScotlandSenegalSerbiaSierra LeoneSingaporeSomaliaSouth AfricaSouth AmericaSouth Central AsiaSouth Eastern AsiaSouthern EuropeSpainSri LankaSt. Vincent and the GrenadinesSudanSwedenSwitzerlandSyriaTaiwanThailandTrinidad and TobagoTurkeyUgandaUkraineUruguayUzbekistanVenezuelaVietnamWest IndiesWestern AfricaWestern AsiaWestern EuropeYemenZaireZimbabweAzores
In Labor Force | Age 20-24
Income
Poverty
Unemployment
Labor Participation
Family Structure
Vehicle Availability
Education Level
Disability

In Labor Force | Age 20-24 Comparison

Macedonians

Yuman

Exceptional
Tragic
76.0%
IN LABOR FORCE | AGE 20-24
97.2/ 100
METRIC RATING
104th/ 347
METRIC RANK
70.3%
IN LABOR FORCE | AGE 20-24
0.0/ 100
METRIC RATING
333rd/ 347
METRIC RANK

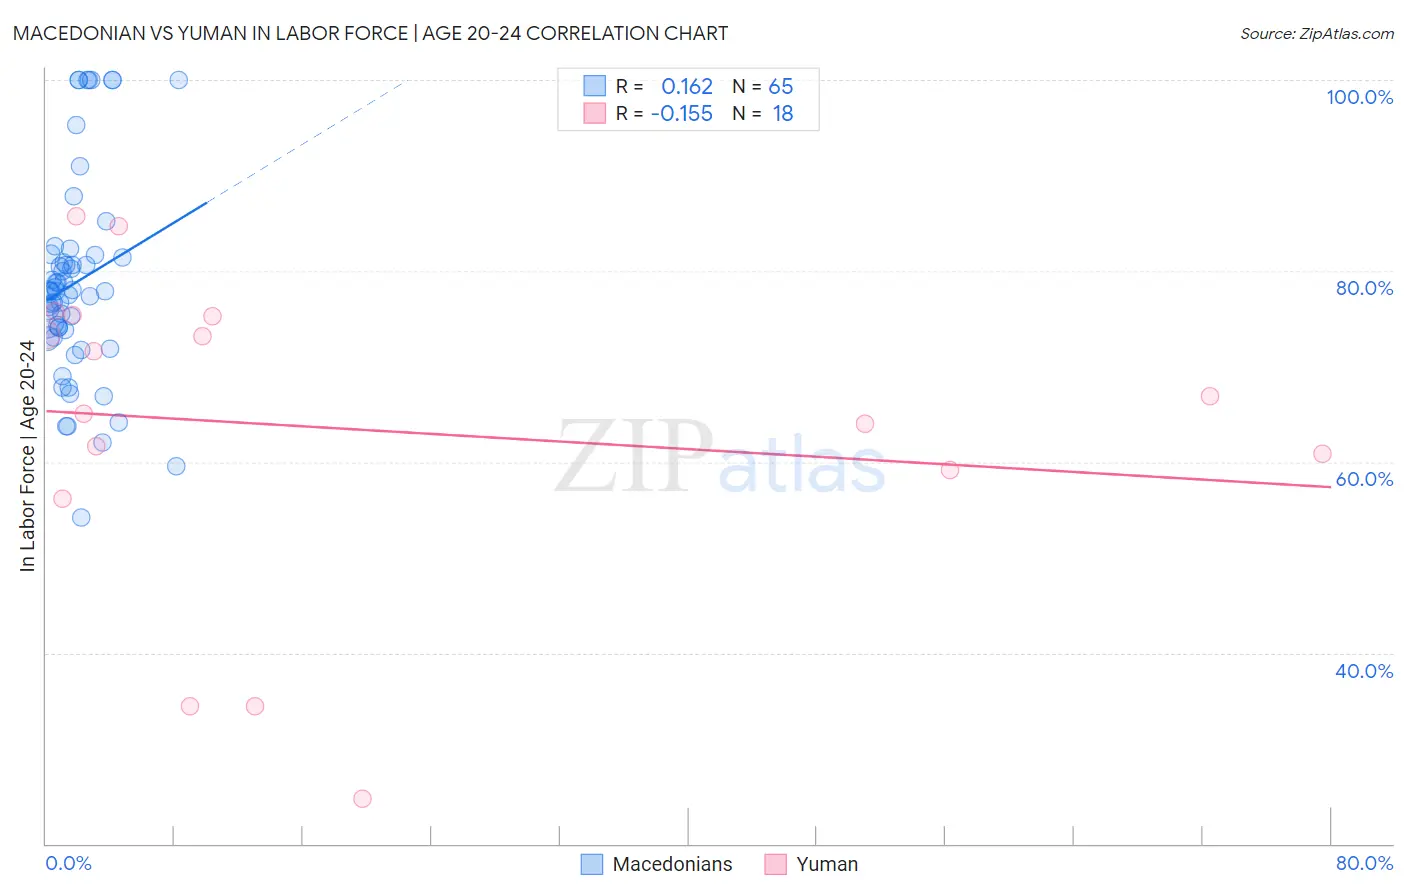
Macedonian vs Yuman In Labor Force | Age 20-24 Correlation Chart

The statistical analysis conducted on geographies consisting of 132,643,632 people shows a poor positive correlation between the proportion of Macedonians and labor force participation rate among population between the ages 20 and 24 in the United States with a correlation coefficient (R) of 0.162 and weighted average of 76.0%. Similarly, the statistical analysis conducted on geographies consisting of 40,677,141 people shows a poor negative correlation between the proportion of Yuman and labor force participation rate among population between the ages 20 and 24 in the United States with a correlation coefficient (R) of -0.155 and weighted average of 70.3%, a difference of 8.2%.
Macedonian vs Yuman In Labor Force | Age 20-24

In Labor Force | Age 20-24 Correlation Summary

MeasurementMacedonianYuman
Minimum54.2%24.7%
Maximum100.0%85.7%
Range45.8%61.0%
Mean78.8%63.4%
Median77.9%66.0%
Interquartile 25% (IQ1)73.5%59.1%
Interquartile 75% (IQ3)81.5%75.2%
Interquartile Range (IQR)8.1%16.1%
Standard Deviation (Sample)10.6%17.0%
Standard Deviation (Population)10.5%16.5%

Similar Demographics by In Labor Force | Age 20-24

Demographics Similar to Macedonians by In Labor Force | Age 20-24

In terms of in labor force | age 20-24, the demographic groups most similar to Macedonians are Immigrants from Nepal (76.0%, a difference of 0.0%), Immigrants from Uganda (76.0%, a difference of 0.020%), Immigrants from North Macedonia (76.1%, a difference of 0.040%), Greek (76.0%, a difference of 0.040%), and Latvian (76.1%, a difference of 0.060%).
DemographicsRating | RankIn Labor Force | Age 20-24
Immigrants | Lithuania
98.0
/100
|
#97
Exceptional
76.1%
Immigrants | Oceania
98.0
/100
|
#98
Exceptional
76.1%
Americans
97.8
/100
|
#99
Exceptional
76.1%
Shoshone
97.8
/100
|
#100
Exceptional
76.1%
Immigrants | Poland
97.7
/100
|
#101
Exceptional
76.1%
Latvians
97.6
/100
|
#102
Exceptional
76.1%
Immigrants | North Macedonia
97.5
/100
|
#103
Exceptional
76.1%
Macedonians
97.2
/100
|
#104
Exceptional
76.0%
Immigrants | Nepal
97.2
/100
|
#105
Exceptional
76.0%
Immigrants | Uganda
97.1
/100
|
#106
Exceptional
76.0%
Greeks
96.9
/100
|
#107
Exceptional
76.0%
Iraqis
96.6
/100
|
#108
Exceptional
76.0%
Cherokee
95.8
/100
|
#109
Exceptional
75.9%
Immigrants | Morocco
95.8
/100
|
#110
Exceptional
75.9%
Ukrainians
95.7
/100
|
#111
Exceptional
75.9%

Demographics Similar to Yuman by In Labor Force | Age 20-24

In terms of in labor force | age 20-24, the demographic groups most similar to Yuman are Immigrants from Uzbekistan (70.4%, a difference of 0.23%), British West Indian (70.0%, a difference of 0.41%), Immigrants from Bangladesh (70.6%, a difference of 0.53%), Vietnamese (70.6%, a difference of 0.55%), and Immigrants from Barbados (69.7%, a difference of 0.75%).
DemographicsRating | RankIn Labor Force | Age 20-24
Dominicans
0.0
/100
|
#326
Tragic
71.1%
Immigrants | Trinidad and Tobago
0.0
/100
|
#327
Tragic
71.1%
Immigrants | China
0.0
/100
|
#328
Tragic
71.1%
Yup'ik
0.0
/100
|
#329
Tragic
70.9%
Vietnamese
0.0
/100
|
#330
Tragic
70.6%
Immigrants | Bangladesh
0.0
/100
|
#331
Tragic
70.6%
Immigrants | Uzbekistan
0.0
/100
|
#332
Tragic
70.4%
Yuman
0.0
/100
|
#333
Tragic
70.3%
British West Indians
0.0
/100
|
#334
Tragic
70.0%
Immigrants | Barbados
0.0
/100
|
#335
Tragic
69.7%
Immigrants | Guyana
0.0
/100
|
#336
Tragic
69.3%
Guyanese
0.0
/100
|
#337
Tragic
69.2%
Pima
0.0
/100
|
#338
Tragic
69.0%
Immigrants | Yemen
0.0
/100
|
#339
Tragic
68.9%
Menominee
0.0
/100
|
#340
Tragic
68.7%