Luxembourger vs Slovak In Labor Force | Age 25-29

COMPARE

Luxembourger
Race
Ancestry
AfghanAfricanAlaska NativeAlaskan AthabascanAlbanianAleutAlsatianAmericanApacheArabArapahoArgentineanArmenianAssyrian/Chaldean/SyriacAustralianAustrianBahamianBangladeshiBarbadianBasqueBelgianBelizeanBermudanBhutaneseBlackfeetBolivianBrazilianBritishBritish West IndianBulgarianBurmeseCajunCambodianCanadianCape VerdeanCarpatho RusynCelticCentral AmericanCentral American IndianCherokeeCheyenneChickasawChileanChineseChippewaChoctawColombianColvilleComancheCosta RicanCreeCreekCroatianCrowCubanCypriotCzechCzechoslovakianDanishDelawareDominicanDutchDutch West IndianEastern EuropeanEcuadorianEgyptianEnglishEstonianEthiopianEuropeanFijianFilipinoFinnishFrenchFrench American IndianFrench CanadianGermanGerman RussianGhanaianGreekGuamanian/ChamorroGuatemalanGuyaneseHaitianHmongHonduranHopiHoumaHungarianIcelanderIndian (Asian)IndonesianInupiatIranianIraqiIrishIroquoisIsraeliItalianJamaicanJapaneseJordanianKenyanKiowaKoreanLaotianLatvianLebaneseLiberianLithuanianLumbeeLuxembourgerMacedonianMalaysianMalteseMarshalleseMenomineeMexicanMexican American IndianMongolianMoroccanNative HawaiianNavajoNepaleseNew ZealanderNicaraguanNigerianNorthern EuropeanNorwegianOkinawanOsageOttawaPaiutePakistaniPalestinianPanamanianParaguayanPennsylvania GermanPeruvianPimaPolishPortuguesePotawatomiPuebloPuerto RicanPuget Sound SalishRomanianRussianSalvadoranSamoanScandinavianScotch-IrishScottishSeminoleSenegaleseSerbianShoshoneSierra LeoneanSiouxSlavicSloveneSomaliSouth AfricanSouth AmericanSouth American IndianSoviet UnionSpaniardSpanishSpanish AmericanSpanish American IndianSri LankanSubsaharan AfricanSudaneseSwedishSwissSyrianTaiwaneseThaiTlingit-HaidaTohono O'OdhamTonganTrinidadian and TobagonianTsimshianTurkishU.S. Virgin IslanderUgandanUkrainianUruguayanUteVenezuelanVietnameseWelshWest IndianYakamaYaquiYugoslavianYumanYup'ikZimbabwean
Immigration
NonimmigrantsImmigrantsAfghanistanAfricaAlbaniaArgentinaArmeniaAsiaAustraliaAustriaBahamasBangladeshBarbadosBelarusBelgiumBelizeBoliviaBosnia and HerzegovinaBrazilBulgariaBurma/MyanmarCabo VerdeCambodiaCameroonCanadaCaribbeanCentral AmericaChileChinaColombiaCongoCosta RicaCroatiaCubaCzechoslovakiaDenmarkDominicaDominican RepublicEastern AfricaEastern AsiaEastern EuropeEcuadorEgyptEl SalvadorEnglandEritreaEthiopiaEuropeFijiFranceGermanyGhanaGreeceGrenadaGuatemalaGuyanaHaitiHondurasHong KongHungaryIndiaIndonesiaIranIraqIrelandIsraelItalyJamaicaJapanJordanKazakhstanKenyaKoreaKuwaitLaosLatin AmericaLatviaLebanonLiberiaLithuaniaMalaysiaMexicoMicronesiaMiddle AfricaMoldovaMoroccoNepalNetherlandsNicaraguaNigeriaNorth AmericaNorth MacedoniaNorthern AfricaNorthern EuropeNorwayOceaniaPakistanPanamaPeruPhilippinesPolandPortugalRomaniaRussiaSaudi ArabiaScotlandSenegalSerbiaSierra LeoneSingaporeSomaliaSouth AfricaSouth AmericaSouth Central AsiaSouth Eastern AsiaSouthern EuropeSpainSri LankaSt. Vincent and the GrenadinesSudanSwedenSwitzerlandSyriaTaiwanThailandTrinidad and TobagoTurkeyUgandaUkraineUruguayUzbekistanVenezuelaVietnamWest IndiesWestern AfricaWestern AsiaWestern EuropeYemenZaireZimbabweAzores
Slovak
Race
Ancestry
AfghanAfricanAlaska NativeAlaskan AthabascanAlbanianAleutAlsatianAmericanApacheArabArapahoArgentineanArmenianAssyrian/Chaldean/SyriacAustralianAustrianBahamianBangladeshiBarbadianBasqueBelgianBelizeanBermudanBhutaneseBlackfeetBolivianBrazilianBritishBritish West IndianBulgarianBurmeseCajunCambodianCanadianCape VerdeanCarpatho RusynCelticCentral AmericanCentral American IndianCherokeeCheyenneChickasawChileanChineseChippewaChoctawColombianColvilleComancheCosta RicanCreeCreekCroatianCrowCubanCypriotCzechCzechoslovakianDanishDelawareDominicanDutchDutch West IndianEastern EuropeanEcuadorianEgyptianEnglishEstonianEthiopianEuropeanFijianFilipinoFinnishFrenchFrench American IndianFrench CanadianGermanGerman RussianGhanaianGreekGuamanian/ChamorroGuatemalanGuyaneseHaitianHmongHonduranHopiHoumaHungarianIcelanderIndian (Asian)IndonesianInupiatIranianIraqiIrishIroquoisIsraeliItalianJamaicanJapaneseJordanianKenyanKiowaKoreanLaotianLatvianLebaneseLiberianLithuanianLumbeeMacedonianMalaysianMalteseMarshalleseMenomineeMexicanMexican American IndianMongolianMoroccanNative HawaiianNavajoNepaleseNew ZealanderNicaraguanNigerianNorthern EuropeanNorwegianOkinawanOsageOttawaPaiutePakistaniPalestinianPanamanianParaguayanPennsylvania GermanPeruvianPimaPolishPortuguesePotawatomiPuebloPuerto RicanPuget Sound SalishRomanianRussianSalvadoranSamoanScandinavianScotch-IrishScottishSeminoleSenegaleseSerbianShoshoneSierra LeoneanSiouxSlavicSlovakSloveneSomaliSouth AfricanSouth AmericanSouth American IndianSoviet UnionSpaniardSpanishSpanish AmericanSpanish American IndianSri LankanSubsaharan AfricanSudaneseSwedishSwissSyrianTaiwaneseThaiTlingit-HaidaTohono O'OdhamTonganTrinidadian and TobagonianTsimshianTurkishU.S. Virgin IslanderUgandanUkrainianUruguayanUteVenezuelanVietnameseWelshWest IndianYakamaYaquiYugoslavianYumanYup'ikZimbabwean
Immigration
NonimmigrantsImmigrantsAfghanistanAfricaAlbaniaArgentinaArmeniaAsiaAustraliaAustriaBahamasBangladeshBarbadosBelarusBelgiumBelizeBoliviaBosnia and HerzegovinaBrazilBulgariaBurma/MyanmarCabo VerdeCambodiaCameroonCanadaCaribbeanCentral AmericaChileChinaColombiaCongoCosta RicaCroatiaCubaCzechoslovakiaDenmarkDominicaDominican RepublicEastern AfricaEastern AsiaEastern EuropeEcuadorEgyptEl SalvadorEnglandEritreaEthiopiaEuropeFijiFranceGermanyGhanaGreeceGrenadaGuatemalaGuyanaHaitiHondurasHong KongHungaryIndiaIndonesiaIranIraqIrelandIsraelItalyJamaicaJapanJordanKazakhstanKenyaKoreaKuwaitLaosLatin AmericaLatviaLebanonLiberiaLithuaniaMalaysiaMexicoMicronesiaMiddle AfricaMoldovaMoroccoNepalNetherlandsNicaraguaNigeriaNorth AmericaNorth MacedoniaNorthern AfricaNorthern EuropeNorwayOceaniaPakistanPanamaPeruPhilippinesPolandPortugalRomaniaRussiaSaudi ArabiaScotlandSenegalSerbiaSierra LeoneSingaporeSomaliaSouth AfricaSouth AmericaSouth Central AsiaSouth Eastern AsiaSouthern EuropeSpainSri LankaSt. Vincent and the GrenadinesSudanSwedenSwitzerlandSyriaTaiwanThailandTrinidad and TobagoTurkeyUgandaUkraineUruguayUzbekistanVenezuelaVietnamWest IndiesWestern AfricaWestern AsiaWestern EuropeYemenZaireZimbabweAzores
In Labor Force | Age 25-29
Income
Poverty
Unemployment
Labor Participation
Family Structure
Vehicle Availability
Education Level
Disability

In Labor Force | Age 25-29 Comparison

Luxembourgers

Slovaks

Exceptional
Exceptional
86.9%
IN LABOR FORCE | AGE 25-29
100.0/ 100
METRIC RATING
5th/ 347
METRIC RANK
85.8%
IN LABOR FORCE | AGE 25-29
100.0/ 100
METRIC RATING
32nd/ 347
METRIC RANK

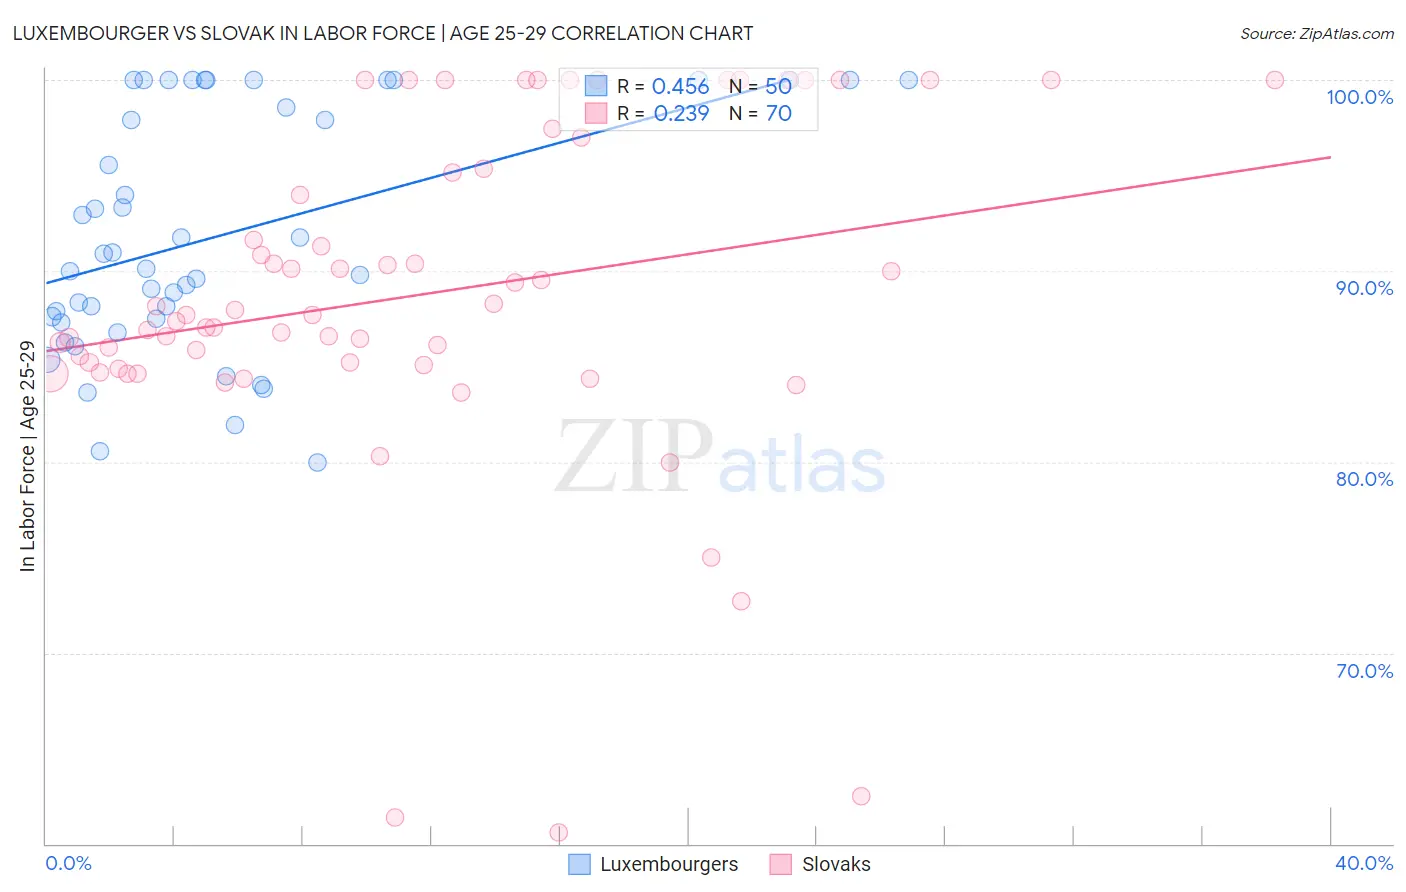
Luxembourger vs Slovak In Labor Force | Age 25-29 Correlation Chart

The statistical analysis conducted on geographies consisting of 144,653,840 people shows a moderate positive correlation between the proportion of Luxembourgers and labor force participation rate among population between the ages 25 and 29 in the United States with a correlation coefficient (R) of 0.456 and weighted average of 86.9%. Similarly, the statistical analysis conducted on geographies consisting of 397,677,043 people shows a weak positive correlation between the proportion of Slovaks and labor force participation rate among population between the ages 25 and 29 in the United States with a correlation coefficient (R) of 0.239 and weighted average of 85.8%, a difference of 1.2%.
Luxembourger vs Slovak In Labor Force | Age 25-29

In Labor Force | Age 25-29 Correlation Summary

MeasurementLuxembourgerSlovak
Minimum80.0%60.6%
Maximum100.0%100.0%
Range20.0%39.4%
Mean91.9%88.8%
Median90.5%87.7%
Interquartile 25% (IQ1)87.5%85.1%
Interquartile 75% (IQ3)100.0%95.4%
Interquartile Range (IQR)12.5%10.3%
Standard Deviation (Sample)6.2%8.8%
Standard Deviation (Population)6.2%8.7%

Similar Demographics by In Labor Force | Age 25-29

Demographics Similar to Luxembourgers by In Labor Force | Age 25-29

In terms of in labor force | age 25-29, the demographic groups most similar to Luxembourgers are Carpatho Rusyn (87.0%, a difference of 0.10%), Immigrants from Somalia (87.1%, a difference of 0.19%), Somali (87.1%, a difference of 0.19%), Slovene (86.4%, a difference of 0.62%), and Immigrants from Bosnia and Herzegovina (86.3%, a difference of 0.74%).
DemographicsRating | RankIn Labor Force | Age 25-29
Tsimshian
100.0
/100
|
#1
Exceptional
88.7%
Immigrants | Somalia
100.0
/100
|
#2
Exceptional
87.1%
Somalis
100.0
/100
|
#3
Exceptional
87.1%
Carpatho Rusyns
100.0
/100
|
#4
Exceptional
87.0%
Luxembourgers
100.0
/100
|
#5
Exceptional
86.9%
Slovenes
100.0
/100
|
#6
Exceptional
86.4%
Immigrants | Bosnia and Herzegovina
100.0
/100
|
#7
Exceptional
86.3%
Immigrants | Cabo Verde
100.0
/100
|
#8
Exceptional
86.2%
Ethiopians
100.0
/100
|
#9
Exceptional
86.2%
Liberians
100.0
/100
|
#10
Exceptional
86.1%
Immigrants | Ethiopia
100.0
/100
|
#11
Exceptional
86.1%
Immigrants | Lithuania
100.0
/100
|
#12
Exceptional
86.1%
Norwegians
100.0
/100
|
#13
Exceptional
86.1%
Latvians
100.0
/100
|
#14
Exceptional
86.1%
Bolivians
100.0
/100
|
#15
Exceptional
86.1%

Demographics Similar to Slovaks by In Labor Force | Age 25-29

In terms of in labor force | age 25-29, the demographic groups most similar to Slovaks are German Russian (85.8%, a difference of 0.0%), Immigrants from Bulgaria (85.8%, a difference of 0.0%), Immigrants from Serbia (85.9%, a difference of 0.010%), Lithuanian (85.8%, a difference of 0.030%), and Cypriot (85.8%, a difference of 0.040%).
DemographicsRating | RankIn Labor Force | Age 25-29
Sudanese
100.0
/100
|
#25
Exceptional
85.9%
Immigrants | North Macedonia
100.0
/100
|
#26
Exceptional
85.9%
Paraguayans
100.0
/100
|
#27
Exceptional
85.9%
Ugandans
100.0
/100
|
#28
Exceptional
85.9%
Immigrants | Liberia
100.0
/100
|
#29
Exceptional
85.9%
Immigrants | Serbia
100.0
/100
|
#30
Exceptional
85.9%
German Russians
100.0
/100
|
#31
Exceptional
85.8%
Slovaks
100.0
/100
|
#32
Exceptional
85.8%
Immigrants | Bulgaria
100.0
/100
|
#33
Exceptional
85.8%
Lithuanians
99.9
/100
|
#34
Exceptional
85.8%
Cypriots
99.9
/100
|
#35
Exceptional
85.8%
Immigrants | Nepal
99.9
/100
|
#36
Exceptional
85.8%
Poles
99.9
/100
|
#37
Exceptional
85.8%
Sierra Leoneans
99.9
/100
|
#38
Exceptional
85.8%
Croatians
99.9
/100
|
#39
Exceptional
85.8%