Luxembourger vs Chilean In Labor Force | Age 20-64

COMPARE

Luxembourger
Race
Ancestry
AfghanAfricanAlaska NativeAlaskan AthabascanAlbanianAleutAlsatianAmericanApacheArabArapahoArgentineanArmenianAssyrian/Chaldean/SyriacAustralianAustrianBahamianBangladeshiBarbadianBasqueBelgianBelizeanBermudanBhutaneseBlackfeetBolivianBrazilianBritishBritish West IndianBulgarianBurmeseCajunCambodianCanadianCape VerdeanCarpatho RusynCelticCentral AmericanCentral American IndianCherokeeCheyenneChickasawChineseChippewaChoctawColombianColvilleComancheCosta RicanCreeCreekCroatianCrowCubanCypriotCzechCzechoslovakianDanishDelawareDominicanDutchDutch West IndianEastern EuropeanEcuadorianEgyptianEnglishEstonianEthiopianEuropeanFijianFilipinoFinnishFrenchFrench American IndianFrench CanadianGermanGerman RussianGhanaianGreekGuamanian/ChamorroGuatemalanGuyaneseHaitianHmongHonduranHopiHoumaHungarianIcelanderIndian (Asian)IndonesianInupiatIranianIraqiIrishIroquoisIsraeliItalianJamaicanJapaneseJordanianKenyanKiowaKoreanLaotianLatvianLebaneseLiberianLithuanianLumbeeLuxembourgerMacedonianMalaysianMalteseMarshalleseMenomineeMexicanMexican American IndianMongolianMoroccanNative HawaiianNavajoNepaleseNew ZealanderNicaraguanNigerianNorthern EuropeanNorwegianOkinawanOsageOttawaPaiutePakistaniPalestinianPanamanianParaguayanPennsylvania GermanPeruvianPimaPolishPortuguesePotawatomiPuebloPuerto RicanPuget Sound SalishRomanianRussianSalvadoranSamoanScandinavianScotch-IrishScottishSeminoleSenegaleseSerbianShoshoneSierra LeoneanSiouxSlavicSlovakSloveneSomaliSouth AfricanSouth AmericanSouth American IndianSoviet UnionSpaniardSpanishSpanish AmericanSpanish American IndianSri LankanSubsaharan AfricanSudaneseSwedishSwissSyrianTaiwaneseThaiTlingit-HaidaTohono O'OdhamTonganTrinidadian and TobagonianTsimshianTurkishU.S. Virgin IslanderUgandanUkrainianUruguayanUteVenezuelanVietnameseWelshWest IndianYakamaYaquiYugoslavianYumanYup'ikZimbabwean
Immigration
NonimmigrantsImmigrantsAfghanistanAfricaAlbaniaArgentinaArmeniaAsiaAustraliaAustriaBahamasBangladeshBarbadosBelarusBelgiumBelizeBoliviaBosnia and HerzegovinaBrazilBulgariaBurma/MyanmarCabo VerdeCambodiaCameroonCanadaCaribbeanCentral AmericaChileChinaColombiaCongoCosta RicaCroatiaCubaCzechoslovakiaDenmarkDominicaDominican RepublicEastern AfricaEastern AsiaEastern EuropeEcuadorEgyptEl SalvadorEnglandEritreaEthiopiaEuropeFijiFranceGermanyGhanaGreeceGrenadaGuatemalaGuyanaHaitiHondurasHong KongHungaryIndiaIndonesiaIranIraqIrelandIsraelItalyJamaicaJapanJordanKazakhstanKenyaKoreaKuwaitLaosLatin AmericaLatviaLebanonLiberiaLithuaniaMalaysiaMexicoMicronesiaMiddle AfricaMoldovaMoroccoNepalNetherlandsNicaraguaNigeriaNorth AmericaNorth MacedoniaNorthern AfricaNorthern EuropeNorwayOceaniaPakistanPanamaPeruPhilippinesPolandPortugalRomaniaRussiaSaudi ArabiaScotlandSenegalSerbiaSierra LeoneSingaporeSomaliaSouth AfricaSouth AmericaSouth Central AsiaSouth Eastern AsiaSouthern EuropeSpainSri LankaSt. Vincent and the GrenadinesSudanSwedenSwitzerlandSyriaTaiwanThailandTrinidad and TobagoTurkeyUgandaUkraineUruguayUzbekistanVenezuelaVietnamWest IndiesWestern AfricaWestern AsiaWestern EuropeYemenZaireZimbabweAzores
Chilean
Race
Ancestry
AfghanAfricanAlaska NativeAlaskan AthabascanAlbanianAleutAlsatianAmericanApacheArabArapahoArgentineanArmenianAssyrian/Chaldean/SyriacAustralianAustrianBahamianBangladeshiBarbadianBasqueBelgianBelizeanBermudanBhutaneseBlackfeetBolivianBrazilianBritishBritish West IndianBulgarianBurmeseCajunCambodianCanadianCape VerdeanCarpatho RusynCelticCentral AmericanCentral American IndianCherokeeCheyenneChickasawChileanChineseChippewaChoctawColombianColvilleComancheCosta RicanCreeCreekCroatianCrowCubanCypriotCzechCzechoslovakianDanishDelawareDominicanDutchDutch West IndianEastern EuropeanEcuadorianEgyptianEnglishEstonianEthiopianEuropeanFijianFilipinoFinnishFrenchFrench American IndianFrench CanadianGermanGerman RussianGhanaianGreekGuamanian/ChamorroGuatemalanGuyaneseHaitianHmongHonduranHopiHoumaHungarianIcelanderIndian (Asian)IndonesianInupiatIranianIraqiIrishIroquoisIsraeliItalianJamaicanJapaneseJordanianKenyanKiowaKoreanLaotianLatvianLebaneseLiberianLithuanianLumbeeMacedonianMalaysianMalteseMarshalleseMenomineeMexicanMexican American IndianMongolianMoroccanNative HawaiianNavajoNepaleseNew ZealanderNicaraguanNigerianNorthern EuropeanNorwegianOkinawanOsageOttawaPaiutePakistaniPalestinianPanamanianParaguayanPennsylvania GermanPeruvianPimaPolishPortuguesePotawatomiPuebloPuerto RicanPuget Sound SalishRomanianRussianSalvadoranSamoanScandinavianScotch-IrishScottishSeminoleSenegaleseSerbianShoshoneSierra LeoneanSiouxSlavicSlovakSloveneSomaliSouth AfricanSouth AmericanSouth American IndianSoviet UnionSpaniardSpanishSpanish AmericanSpanish American IndianSri LankanSubsaharan AfricanSudaneseSwedishSwissSyrianTaiwaneseThaiTlingit-HaidaTohono O'OdhamTonganTrinidadian and TobagonianTsimshianTurkishU.S. Virgin IslanderUgandanUkrainianUruguayanUteVenezuelanVietnameseWelshWest IndianYakamaYaquiYugoslavianYumanYup'ikZimbabwean
Immigration
NonimmigrantsImmigrantsAfghanistanAfricaAlbaniaArgentinaArmeniaAsiaAustraliaAustriaBahamasBangladeshBarbadosBelarusBelgiumBelizeBoliviaBosnia and HerzegovinaBrazilBulgariaBurma/MyanmarCabo VerdeCambodiaCameroonCanadaCaribbeanCentral AmericaChileChinaColombiaCongoCosta RicaCroatiaCubaCzechoslovakiaDenmarkDominicaDominican RepublicEastern AfricaEastern AsiaEastern EuropeEcuadorEgyptEl SalvadorEnglandEritreaEthiopiaEuropeFijiFranceGermanyGhanaGreeceGrenadaGuatemalaGuyanaHaitiHondurasHong KongHungaryIndiaIndonesiaIranIraqIrelandIsraelItalyJamaicaJapanJordanKazakhstanKenyaKoreaKuwaitLaosLatin AmericaLatviaLebanonLiberiaLithuaniaMalaysiaMexicoMicronesiaMiddle AfricaMoldovaMoroccoNepalNetherlandsNicaraguaNigeriaNorth AmericaNorth MacedoniaNorthern AfricaNorthern EuropeNorwayOceaniaPakistanPanamaPeruPhilippinesPolandPortugalRomaniaRussiaSaudi ArabiaScotlandSenegalSerbiaSierra LeoneSingaporeSomaliaSouth AfricaSouth AmericaSouth Central AsiaSouth Eastern AsiaSouthern EuropeSpainSri LankaSt. Vincent and the GrenadinesSudanSwedenSwitzerlandSyriaTaiwanThailandTrinidad and TobagoTurkeyUgandaUkraineUruguayUzbekistanVenezuelaVietnamWest IndiesWestern AfricaWestern AsiaWestern EuropeYemenZaireZimbabweAzores
In Labor Force | Age 20-64
Income
Poverty
Unemployment
Labor Participation
Family Structure
Vehicle Availability
Education Level
Disability

In Labor Force | Age 20-64 Comparison

Luxembourgers

Chileans

Exceptional
Exceptional
81.9%
IN LABOR FORCE | AGE 20-64
100.0/ 100
METRIC RATING
4th/ 347
METRIC RANK
80.1%
IN LABOR FORCE | AGE 20-64
97.0/ 100
METRIC RATING
88th/ 347
METRIC RANK

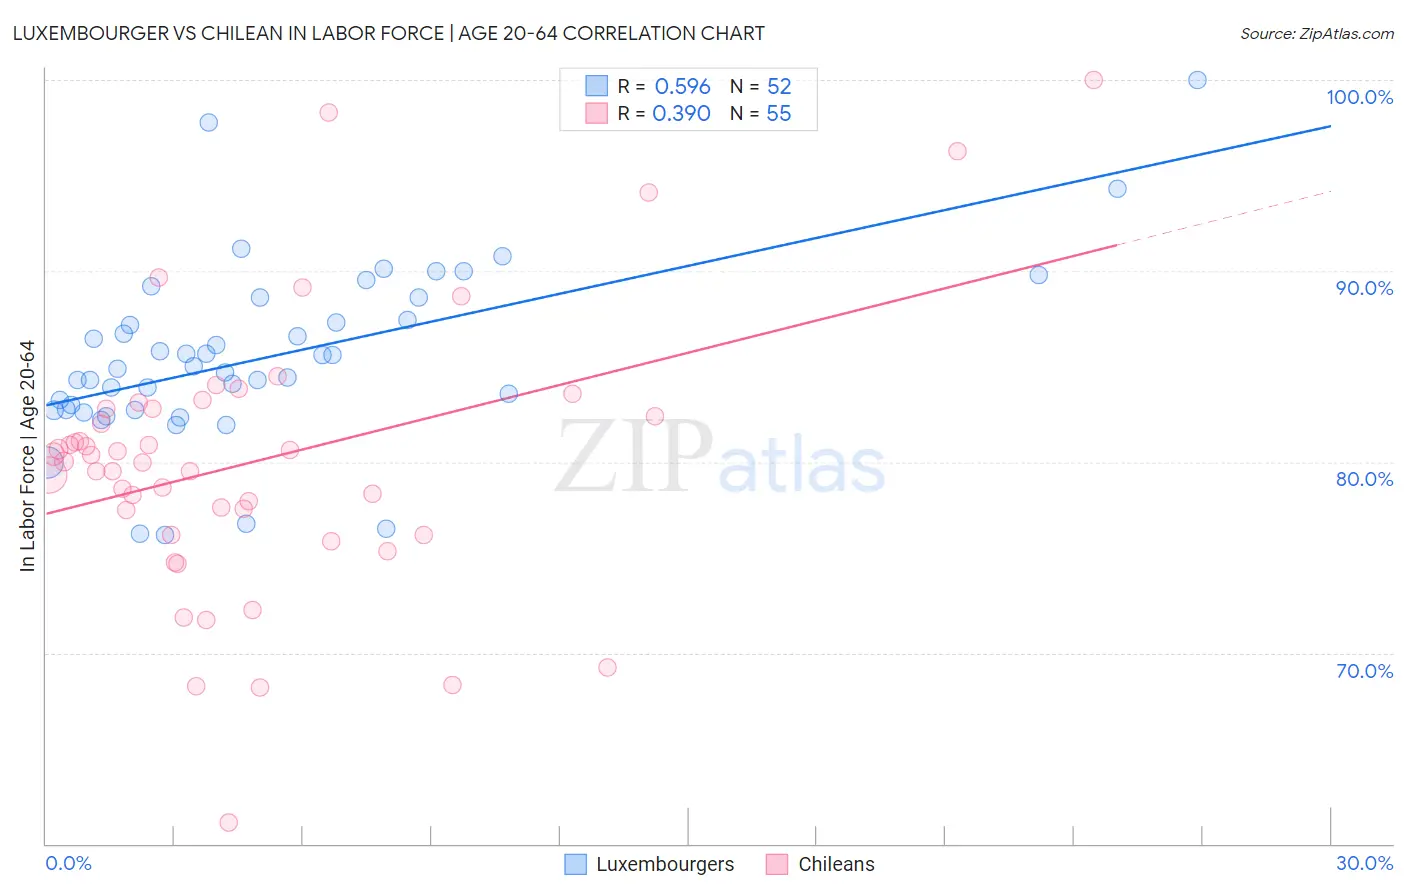
Luxembourger vs Chilean In Labor Force | Age 20-64 Correlation Chart

The statistical analysis conducted on geographies consisting of 144,682,920 people shows a substantial positive correlation between the proportion of Luxembourgers and labor force participation rate among population between the ages 20 and 64 in the United States with a correlation coefficient (R) of 0.596 and weighted average of 81.9%. Similarly, the statistical analysis conducted on geographies consisting of 256,687,224 people shows a mild positive correlation between the proportion of Chileans and labor force participation rate among population between the ages 20 and 64 in the United States with a correlation coefficient (R) of 0.390 and weighted average of 80.1%, a difference of 2.2%.
Luxembourger vs Chilean In Labor Force | Age 20-64

In Labor Force | Age 20-64 Correlation Summary

MeasurementLuxembourgerChilean
Minimum76.2%61.1%
Maximum100.0%100.0%
Range23.8%38.9%
Mean85.5%80.0%
Median84.9%80.0%
Interquartile 25% (IQ1)82.7%76.2%
Interquartile 75% (IQ3)88.0%82.8%
Interquartile Range (IQR)5.3%6.6%
Standard Deviation (Sample)4.7%7.2%
Standard Deviation (Population)4.6%7.1%

Similar Demographics by In Labor Force | Age 20-64

Demographics Similar to Luxembourgers by In Labor Force | Age 20-64

In terms of in labor force | age 20-64, the demographic groups most similar to Luxembourgers are Immigrants from Bolivia (81.9%, a difference of 0.12%), Ethiopian (82.0%, a difference of 0.13%), Bolivian (81.7%, a difference of 0.20%), Immigrants from Ethiopia (82.1%, a difference of 0.25%), and Somali (81.6%, a difference of 0.31%).
DemographicsRating | RankIn Labor Force | Age 20-64
Immigrants | Ethiopia
100.0
/100
|
#1
Exceptional
82.1%
Ethiopians
100.0
/100
|
#2
Exceptional
82.0%
Immigrants | Bolivia
100.0
/100
|
#3
Exceptional
81.9%
Luxembourgers
100.0
/100
|
#4
Exceptional
81.9%
Bolivians
100.0
/100
|
#5
Exceptional
81.7%
Somalis
100.0
/100
|
#6
Exceptional
81.6%
Immigrants | Cameroon
100.0
/100
|
#7
Exceptional
81.6%
Immigrants | Somalia
100.0
/100
|
#8
Exceptional
81.6%
Sierra Leoneans
100.0
/100
|
#9
Exceptional
81.5%
Immigrants | Sierra Leone
100.0
/100
|
#10
Exceptional
81.5%
Immigrants | Eastern Africa
100.0
/100
|
#11
Exceptional
81.3%
Immigrants | Eritrea
100.0
/100
|
#12
Exceptional
81.3%
Immigrants | India
100.0
/100
|
#13
Exceptional
81.3%
Cambodians
100.0
/100
|
#14
Exceptional
81.1%
Bulgarians
100.0
/100
|
#15
Exceptional
81.1%

Demographics Similar to Chileans by In Labor Force | Age 20-64

In terms of in labor force | age 20-64, the demographic groups most similar to Chileans are Jordanian (80.1%, a difference of 0.010%), Immigrants from Egypt (80.1%, a difference of 0.010%), Croatian (80.1%, a difference of 0.010%), Immigrants from Venezuela (80.1%, a difference of 0.010%), and Polish (80.1%, a difference of 0.010%).
DemographicsRating | RankIn Labor Force | Age 20-64
German Russians
97.3
/100
|
#81
Exceptional
80.1%
Immigrants | Japan
97.3
/100
|
#82
Exceptional
80.1%
Colombians
97.3
/100
|
#83
Exceptional
80.1%
Immigrants | Latvia
97.2
/100
|
#84
Exceptional
80.1%
Jordanians
97.2
/100
|
#85
Exceptional
80.1%
Immigrants | Egypt
97.1
/100
|
#86
Exceptional
80.1%
Croatians
97.1
/100
|
#87
Exceptional
80.1%
Chileans
97.0
/100
|
#88
Exceptional
80.1%
Immigrants | Venezuela
96.8
/100
|
#89
Exceptional
80.1%
Poles
96.8
/100
|
#90
Exceptional
80.1%
Uruguayans
96.7
/100
|
#91
Exceptional
80.1%
Ghanaians
96.7
/100
|
#92
Exceptional
80.1%
Immigrants | Belarus
96.4
/100
|
#93
Exceptional
80.1%
Immigrants | Asia
96.0
/100
|
#94
Exceptional
80.1%
Yugoslavians
95.9
/100
|
#95
Exceptional
80.1%