Lithuanian vs Choctaw In Labor Force | Age 20-64
COMPARE
Lithuanian
Choctaw
In Labor Force | Age 20-64
In Labor Force | Age 20-64 Comparison
Lithuanians
Choctaw
80.2%
IN LABOR FORCE | AGE 20-64
98.7/ 100
METRIC RATING
65th/ 347
METRIC RANK
75.4%
IN LABOR FORCE | AGE 20-64
0.0/ 100
METRIC RATING
324th/ 347
METRIC RANK
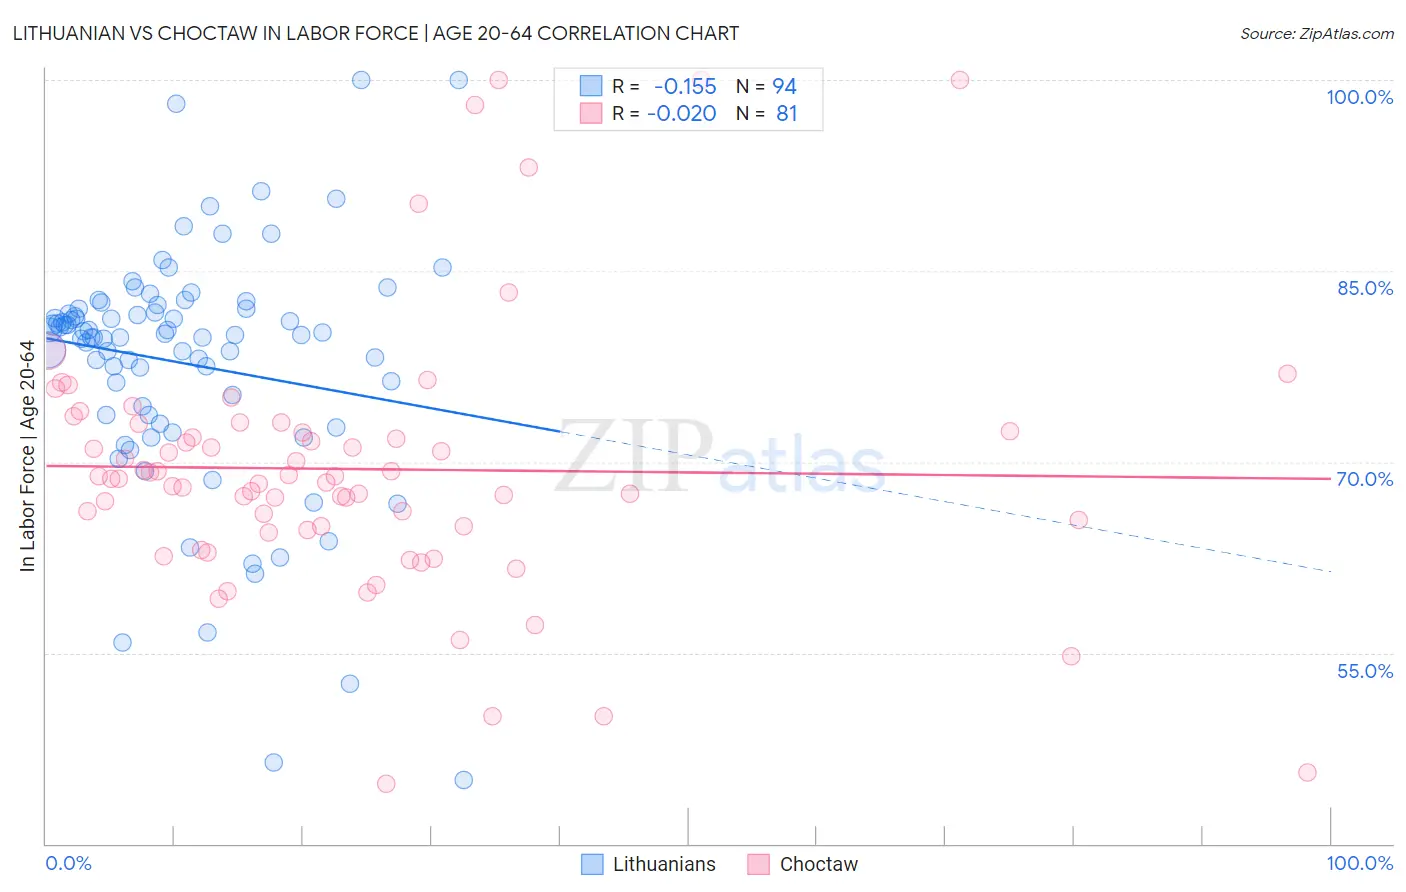
Lithuanian vs Choctaw In Labor Force | Age 20-64 Correlation Chart
The statistical analysis conducted on geographies consisting of 421,962,111 people shows a poor negative correlation between the proportion of Lithuanians and labor force participation rate among population between the ages 20 and 64 in the United States with a correlation coefficient (R) of -0.155 and weighted average of 80.2%. Similarly, the statistical analysis conducted on geographies consisting of 269,719,618 people shows no correlation between the proportion of Choctaw and labor force participation rate among population between the ages 20 and 64 in the United States with a correlation coefficient (R) of -0.020 and weighted average of 75.4%, a difference of 6.4%.
In Labor Force | Age 20-64 Correlation Summary
| Measurement | Lithuanian | Choctaw |
| Minimum | 45.0% | 44.7% |
| Maximum | 100.0% | 100.0% |
| Range | 55.0% | 55.3% |
| Mean | 77.7% | 69.4% |
| Median | 80.0% | 68.7% |
| Interquartile 25% (IQ1) | 73.7% | 64.8% |
| Interquartile 75% (IQ3) | 82.0% | 72.7% |
| Interquartile Range (IQR) | 8.3% | 7.9% |
| Standard Deviation (Sample) | 9.6% | 10.4% |
| Standard Deviation (Population) | 9.5% | 10.4% |
Similar Demographics by In Labor Force | Age 20-64
Demographics Similar to Lithuanians by In Labor Force | Age 20-64
In terms of in labor force | age 20-64, the demographic groups most similar to Lithuanians are Macedonian (80.2%, a difference of 0.0%), Immigrants from Korea (80.3%, a difference of 0.010%), Immigrants from Albania (80.3%, a difference of 0.010%), Taiwanese (80.2%, a difference of 0.010%), and Carpatho Rusyn (80.3%, a difference of 0.020%).
| Demographics | Rating | Rank | In Labor Force | Age 20-64 |
| Serbians | 98.9 /100 | #58 | Exceptional 80.3% |
| Swedes | 98.9 /100 | #59 | Exceptional 80.3% |
| Tongans | 98.8 /100 | #60 | Exceptional 80.3% |
| Burmese | 98.8 /100 | #61 | Exceptional 80.3% |
| Carpatho Rusyns | 98.8 /100 | #62 | Exceptional 80.3% |
| Immigrants | Korea | 98.8 /100 | #63 | Exceptional 80.3% |
| Immigrants | Albania | 98.7 /100 | #64 | Exceptional 80.3% |
| Lithuanians | 98.7 /100 | #65 | Exceptional 80.2% |
| Macedonians | 98.7 /100 | #66 | Exceptional 80.2% |
| Taiwanese | 98.6 /100 | #67 | Exceptional 80.2% |
| Bhutanese | 98.6 /100 | #68 | Exceptional 80.2% |
| Albanians | 98.6 /100 | #69 | Exceptional 80.2% |
| Immigrants | Turkey | 98.5 /100 | #70 | Exceptional 80.2% |
| Soviet Union | 98.5 /100 | #71 | Exceptional 80.2% |
| Eastern Europeans | 98.4 /100 | #72 | Exceptional 80.2% |
Demographics Similar to Choctaw by In Labor Force | Age 20-64
In terms of in labor force | age 20-64, the demographic groups most similar to Choctaw are Cajun (75.5%, a difference of 0.060%), Dutch West Indian (75.5%, a difference of 0.10%), Seminole (75.5%, a difference of 0.14%), Menominee (75.3%, a difference of 0.14%), and Creek (75.1%, a difference of 0.36%).
| Demographics | Rating | Rank | In Labor Force | Age 20-64 |
| Cherokee | 0.0 /100 | #317 | Tragic 76.2% |
| Chickasaw | 0.0 /100 | #318 | Tragic 76.2% |
| Inupiat | 0.0 /100 | #319 | Tragic 76.1% |
| Yakama | 0.0 /100 | #320 | Tragic 75.8% |
| Seminole | 0.0 /100 | #321 | Tragic 75.5% |
| Dutch West Indians | 0.0 /100 | #322 | Tragic 75.5% |
| Cajuns | 0.0 /100 | #323 | Tragic 75.5% |
| Choctaw | 0.0 /100 | #324 | Tragic 75.4% |
| Menominee | 0.0 /100 | #325 | Tragic 75.3% |
| Creek | 0.0 /100 | #326 | Tragic 75.1% |
| Sioux | 0.0 /100 | #327 | Tragic 75.0% |
| Kiowa | 0.0 /100 | #328 | Tragic 75.0% |
| Cheyenne | 0.0 /100 | #329 | Tragic 74.8% |
| Colville | 0.0 /100 | #330 | Tragic 74.8% |
| Paiute | 0.0 /100 | #331 | Tragic 74.7% |