Lebanese vs Immigrants from Bangladesh In Labor Force | Age 45-54

COMPARE

Lebanese
Race
Ancestry
AfghanAfricanAlaska NativeAlaskan AthabascanAlbanianAleutAlsatianAmericanApacheArabArapahoArgentineanArmenianAssyrian/Chaldean/SyriacAustralianAustrianBahamianBangladeshiBarbadianBasqueBelgianBelizeanBermudanBhutaneseBlackfeetBolivianBrazilianBritishBritish West IndianBulgarianBurmeseCajunCambodianCanadianCape VerdeanCarpatho RusynCelticCentral AmericanCentral American IndianCherokeeCheyenneChickasawChileanChineseChippewaChoctawColombianColvilleComancheCosta RicanCreeCreekCroatianCrowCubanCypriotCzechCzechoslovakianDanishDelawareDominicanDutchDutch West IndianEastern EuropeanEcuadorianEgyptianEnglishEstonianEthiopianEuropeanFijianFilipinoFinnishFrenchFrench American IndianFrench CanadianGermanGerman RussianGhanaianGreekGuamanian/ChamorroGuatemalanGuyaneseHaitianHmongHonduranHopiHoumaHungarianIcelanderIndian (Asian)IndonesianInupiatIranianIraqiIrishIroquoisIsraeliItalianJamaicanJapaneseJordanianKenyanKiowaKoreanLaotianLatvianLebaneseLiberianLithuanianLumbeeLuxembourgerMacedonianMalaysianMalteseMarshalleseMenomineeMexicanMexican American IndianMongolianMoroccanNative HawaiianNavajoNepaleseNew ZealanderNicaraguanNigerianNorthern EuropeanNorwegianOkinawanOsageOttawaPaiutePakistaniPalestinianPanamanianParaguayanPennsylvania GermanPeruvianPimaPolishPortuguesePotawatomiPuebloPuerto RicanPuget Sound SalishRomanianRussianSalvadoranSamoanScandinavianScotch-IrishScottishSeminoleSenegaleseSerbianShoshoneSierra LeoneanSiouxSlavicSlovakSloveneSomaliSouth AfricanSouth AmericanSouth American IndianSoviet UnionSpaniardSpanishSpanish AmericanSpanish American IndianSri LankanSubsaharan AfricanSudaneseSwedishSwissSyrianTaiwaneseThaiTlingit-HaidaTohono O'OdhamTonganTrinidadian and TobagonianTsimshianTurkishU.S. Virgin IslanderUgandanUkrainianUruguayanUteVenezuelanVietnameseWelshWest IndianYakamaYaquiYugoslavianYumanYup'ikZimbabwean
Immigration
NonimmigrantsImmigrantsAfghanistanAfricaAlbaniaArgentinaArmeniaAsiaAustraliaAustriaBahamasBarbadosBelarusBelgiumBelizeBoliviaBosnia and HerzegovinaBrazilBulgariaBurma/MyanmarCabo VerdeCambodiaCameroonCanadaCaribbeanCentral AmericaChileChinaColombiaCongoCosta RicaCroatiaCubaCzechoslovakiaDenmarkDominicaDominican RepublicEastern AfricaEastern AsiaEastern EuropeEcuadorEgyptEl SalvadorEnglandEritreaEthiopiaEuropeFijiFranceGermanyGhanaGreeceGrenadaGuatemalaGuyanaHaitiHondurasHong KongHungaryIndiaIndonesiaIranIraqIrelandIsraelItalyJamaicaJapanJordanKazakhstanKenyaKoreaKuwaitLaosLatin AmericaLatviaLebanonLiberiaLithuaniaMalaysiaMexicoMicronesiaMiddle AfricaMoldovaMoroccoNepalNetherlandsNicaraguaNigeriaNorth AmericaNorth MacedoniaNorthern AfricaNorthern EuropeNorwayOceaniaPakistanPanamaPeruPhilippinesPolandPortugalRomaniaRussiaSaudi ArabiaScotlandSenegalSerbiaSierra LeoneSingaporeSomaliaSouth AfricaSouth AmericaSouth Central AsiaSouth Eastern AsiaSouthern EuropeSpainSri LankaSt. Vincent and the GrenadinesSudanSwedenSwitzerlandSyriaTaiwanThailandTrinidad and TobagoTurkeyUgandaUkraineUruguayUzbekistanVenezuelaVietnamWest IndiesWestern AfricaWestern AsiaWestern EuropeYemenZaireZimbabweAzores
Immigrants from Bangladesh
Race
Ancestry
AfghanAfricanAlaska NativeAlaskan AthabascanAlbanianAleutAlsatianAmericanApacheArabArapahoArgentineanArmenianAssyrian/Chaldean/SyriacAustralianAustrianBahamianBangladeshiBarbadianBasqueBelgianBelizeanBermudanBhutaneseBlackfeetBolivianBrazilianBritishBritish West IndianBulgarianBurmeseCajunCambodianCanadianCape VerdeanCarpatho RusynCelticCentral AmericanCentral American IndianCherokeeCheyenneChickasawChileanChineseChippewaChoctawColombianColvilleComancheCosta RicanCreeCreekCroatianCrowCubanCypriotCzechCzechoslovakianDanishDelawareDominicanDutchDutch West IndianEastern EuropeanEcuadorianEgyptianEnglishEstonianEthiopianEuropeanFijianFilipinoFinnishFrenchFrench American IndianFrench CanadianGermanGerman RussianGhanaianGreekGuamanian/ChamorroGuatemalanGuyaneseHaitianHmongHonduranHopiHoumaHungarianIcelanderIndian (Asian)IndonesianInupiatIranianIraqiIrishIroquoisIsraeliItalianJamaicanJapaneseJordanianKenyanKiowaKoreanLaotianLatvianLiberianLithuanianLumbeeLuxembourgerMacedonianMalaysianMalteseMarshalleseMenomineeMexicanMexican American IndianMongolianMoroccanNative HawaiianNavajoNepaleseNew ZealanderNicaraguanNigerianNorthern EuropeanNorwegianOkinawanOsageOttawaPaiutePakistaniPalestinianPanamanianParaguayanPennsylvania GermanPeruvianPimaPolishPortuguesePotawatomiPuebloPuerto RicanPuget Sound SalishRomanianRussianSalvadoranSamoanScandinavianScotch-IrishScottishSeminoleSenegaleseSerbianShoshoneSierra LeoneanSiouxSlavicSlovakSloveneSomaliSouth AfricanSouth AmericanSouth American IndianSoviet UnionSpaniardSpanishSpanish AmericanSpanish American IndianSri LankanSubsaharan AfricanSudaneseSwedishSwissSyrianTaiwaneseThaiTlingit-HaidaTohono O'OdhamTonganTrinidadian and TobagonianTsimshianTurkishU.S. Virgin IslanderUgandanUkrainianUruguayanUteVenezuelanVietnameseWelshWest IndianYakamaYaquiYugoslavianYumanYup'ikZimbabwean
Immigration
NonimmigrantsImmigrantsAfghanistanAfricaAlbaniaArgentinaArmeniaAsiaAustraliaAustriaBahamasBangladeshBarbadosBelarusBelgiumBelizeBoliviaBosnia and HerzegovinaBrazilBulgariaBurma/MyanmarCabo VerdeCambodiaCameroonCanadaCaribbeanCentral AmericaChileChinaColombiaCongoCosta RicaCroatiaCubaCzechoslovakiaDenmarkDominicaDominican RepublicEastern AfricaEastern AsiaEastern EuropeEcuadorEgyptEl SalvadorEnglandEritreaEthiopiaEuropeFijiFranceGermanyGhanaGreeceGrenadaGuatemalaGuyanaHaitiHondurasHong KongHungaryIndiaIndonesiaIranIraqIrelandIsraelItalyJamaicaJapanJordanKazakhstanKenyaKoreaKuwaitLaosLatin AmericaLatviaLebanonLiberiaLithuaniaMalaysiaMexicoMicronesiaMiddle AfricaMoldovaMoroccoNepalNetherlandsNicaraguaNigeriaNorth AmericaNorth MacedoniaNorthern AfricaNorthern EuropeNorwayOceaniaPakistanPanamaPeruPhilippinesPolandPortugalRomaniaRussiaSaudi ArabiaScotlandSenegalSerbiaSierra LeoneSingaporeSomaliaSouth AfricaSouth AmericaSouth Central AsiaSouth Eastern AsiaSouthern EuropeSpainSri LankaSt. Vincent and the GrenadinesSudanSwedenSwitzerlandSyriaTaiwanThailandTrinidad and TobagoTurkeyUgandaUkraineUruguayUzbekistanVenezuelaVietnamWest IndiesWestern AfricaWestern AsiaWestern EuropeYemenZaireZimbabweAzores
In Labor Force | Age 45-54
Income
Poverty
Unemployment
Labor Participation
Family Structure
Vehicle Availability
Education Level
Disability

In Labor Force | Age 45-54 Comparison

Lebanese

Immigrants from Bangladesh

Poor
Tragic
82.5%
IN LABOR FORCE | AGE 45-54
18.2/ 100
METRIC RATING
197th/ 347
METRIC RANK
80.7%
IN LABOR FORCE | AGE 45-54
0.0/ 100
METRIC RATING
289th/ 347
METRIC RANK

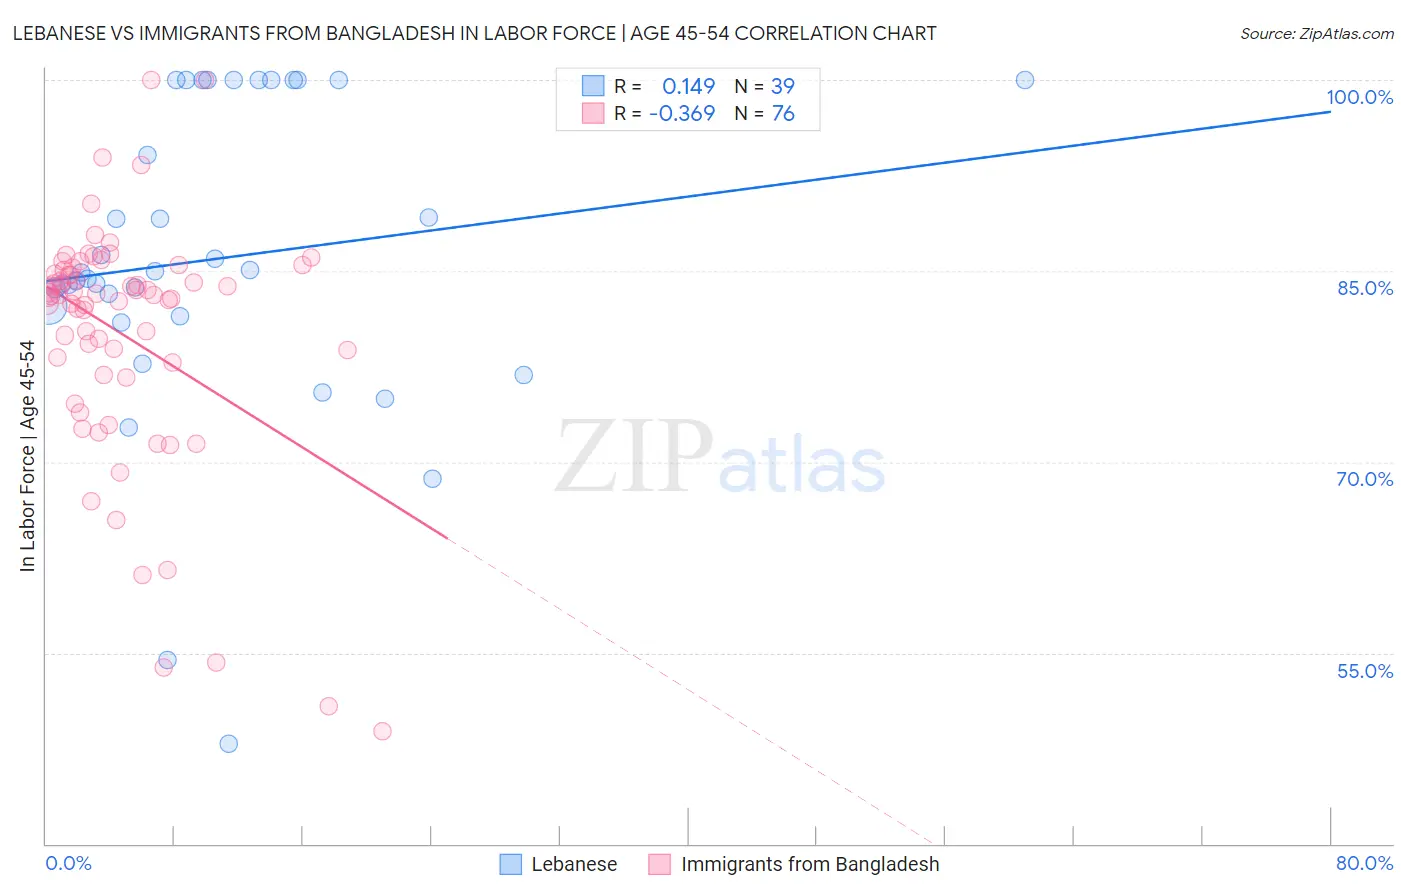
Lebanese vs Immigrants from Bangladesh In Labor Force | Age 45-54 Correlation Chart

The statistical analysis conducted on geographies consisting of 401,315,203 people shows a poor positive correlation between the proportion of Lebanese and labor force participation rate among population between the ages 45 and 54 in the United States with a correlation coefficient (R) of 0.149 and weighted average of 82.5%. Similarly, the statistical analysis conducted on geographies consisting of 203,561,494 people shows a mild negative correlation between the proportion of Immigrants from Bangladesh and labor force participation rate among population between the ages 45 and 54 in the United States with a correlation coefficient (R) of -0.369 and weighted average of 80.7%, a difference of 2.2%.
Lebanese vs Immigrants from Bangladesh In Labor Force | Age 45-54

In Labor Force | Age 45-54 Correlation Summary

MeasurementLebaneseImmigrants from Bangladesh
Minimum47.9%48.8%
Maximum100.0%100.0%
Range52.1%51.2%
Mean86.0%80.0%
Median84.9%83.1%
Interquartile 25% (IQ1)81.5%77.3%
Interquartile 75% (IQ3)100.0%85.0%
Interquartile Range (IQR)18.5%7.6%
Standard Deviation (Sample)12.2%9.7%
Standard Deviation (Population)12.0%9.6%

Similar Demographics by In Labor Force | Age 45-54

Demographics Similar to Lebanese by In Labor Force | Age 45-54

In terms of in labor force | age 45-54, the demographic groups most similar to Lebanese are Immigrants from North America (82.5%, a difference of 0.010%), Immigrants from Denmark (82.5%, a difference of 0.010%), Immigrants from Norway (82.5%, a difference of 0.030%), Immigrants from Canada (82.5%, a difference of 0.030%), and Immigrants from Iraq (82.5%, a difference of 0.040%).
DemographicsRating | RankIn Labor Force | Age 45-54
British
25.7
/100
|
#190
Fair
82.6%
Armenians
23.2
/100
|
#191
Fair
82.5%
Immigrants | Iraq
20.9
/100
|
#192
Fair
82.5%
Australians
20.8
/100
|
#193
Fair
82.5%
Immigrants | Norway
20.7
/100
|
#194
Fair
82.5%
Immigrants | Canada
20.0
/100
|
#195
Fair
82.5%
Immigrants | North America
18.8
/100
|
#196
Poor
82.5%
Lebanese
18.2
/100
|
#197
Poor
82.5%
Immigrants | Denmark
17.9
/100
|
#198
Poor
82.5%
Moroccans
15.7
/100
|
#199
Poor
82.5%
French Canadians
15.4
/100
|
#200
Poor
82.5%
Canadians
15.1
/100
|
#201
Poor
82.4%
Immigrants | Western Asia
14.9
/100
|
#202
Poor
82.4%
Arabs
11.6
/100
|
#203
Poor
82.4%
Immigrants | Western Europe
10.9
/100
|
#204
Poor
82.4%

Demographics Similar to Immigrants from Bangladesh by In Labor Force | Age 45-54

In terms of in labor force | age 45-54, the demographic groups most similar to Immigrants from Bangladesh are Vietnamese (80.8%, a difference of 0.030%), Cree (80.8%, a difference of 0.030%), Mexican American Indian (80.7%, a difference of 0.030%), Delaware (80.8%, a difference of 0.040%), and Immigrants from Dominica (80.8%, a difference of 0.040%).
DemographicsRating | RankIn Labor Force | Age 45-54
Aleuts
0.0
/100
|
#282
Tragic
81.0%
French American Indians
0.0
/100
|
#283
Tragic
80.8%
Belizeans
0.0
/100
|
#284
Tragic
80.8%
Delaware
0.0
/100
|
#285
Tragic
80.8%
Immigrants | Dominica
0.0
/100
|
#286
Tragic
80.8%
Vietnamese
0.0
/100
|
#287
Tragic
80.8%
Cree
0.0
/100
|
#288
Tragic
80.8%
Immigrants | Bangladesh
0.0
/100
|
#289
Tragic
80.7%
Mexican American Indians
0.0
/100
|
#290
Tragic
80.7%
Immigrants | Belize
0.0
/100
|
#291
Tragic
80.6%
Iroquois
0.0
/100
|
#292
Tragic
80.6%
Osage
0.0
/100
|
#293
Tragic
80.6%
Yakama
0.0
/100
|
#294
Tragic
80.6%
Nepalese
0.0
/100
|
#295
Tragic
80.5%
Africans
0.0
/100
|
#296
Tragic
80.5%