Lebanese vs Danish In Labor Force | Age 30-34
COMPARE
Lebanese
Danish
In Labor Force | Age 30-34
In Labor Force | Age 30-34 Comparison
Lebanese
Danes
84.4%
IN LABOR FORCE | AGE 30-34
10.6/ 100
METRIC RATING
206th/ 347
METRIC RANK
84.3%
IN LABOR FORCE | AGE 30-34
5.3/ 100
METRIC RATING
220th/ 347
METRIC RANK
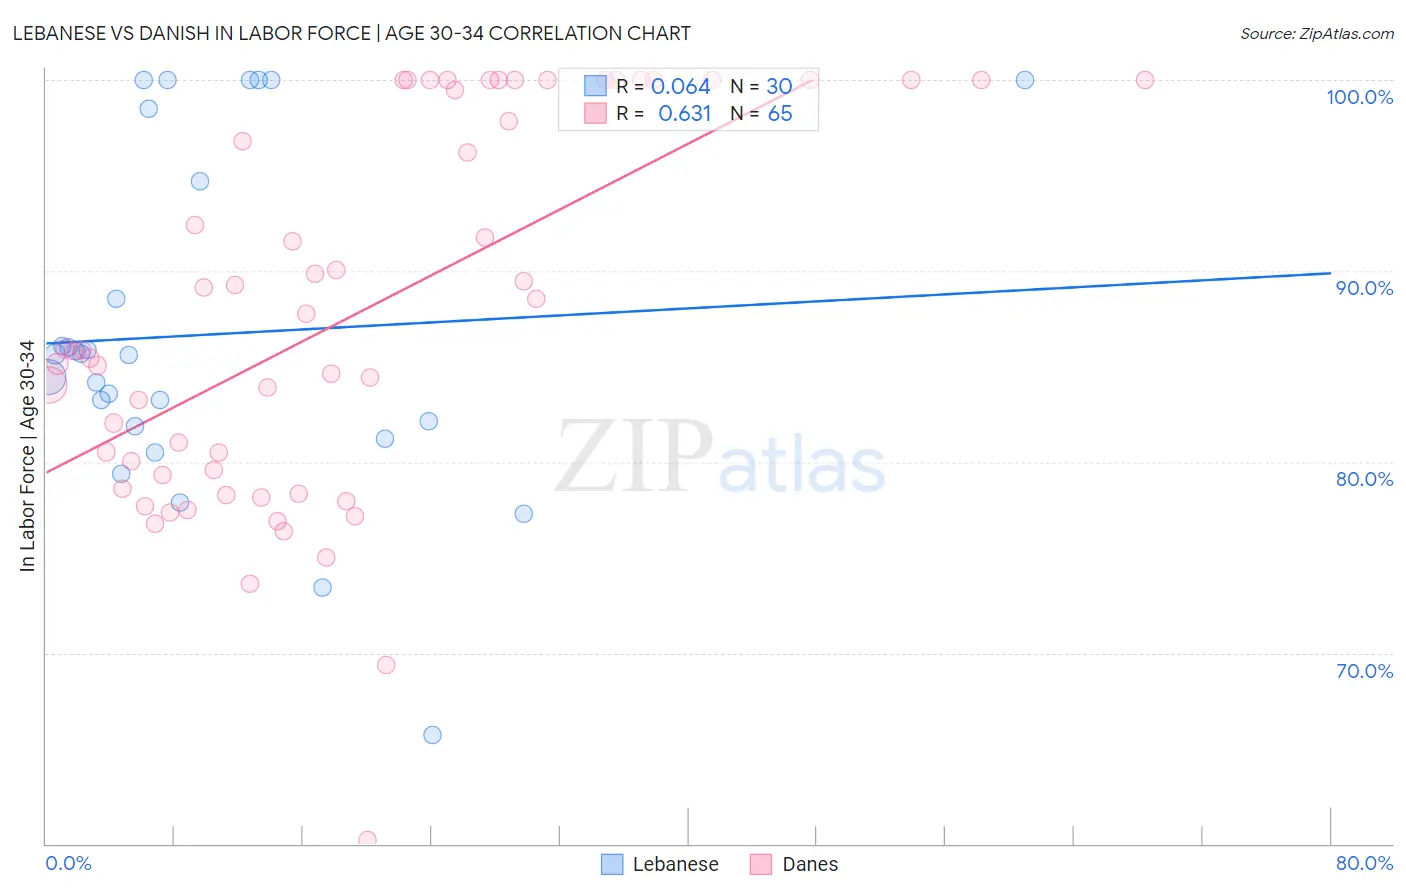
Lebanese vs Danish In Labor Force | Age 30-34 Correlation Chart
The statistical analysis conducted on geographies consisting of 401,295,457 people shows a slight positive correlation between the proportion of Lebanese and labor force participation rate among population between the ages 30 and 34 in the United States with a correlation coefficient (R) of 0.064 and weighted average of 84.4%. Similarly, the statistical analysis conducted on geographies consisting of 473,662,566 people shows a significant positive correlation between the proportion of Danes and labor force participation rate among population between the ages 30 and 34 in the United States with a correlation coefficient (R) of 0.631 and weighted average of 84.3%, a difference of 0.13%.
In Labor Force | Age 30-34 Correlation Summary
| Measurement | Lebanese | Danish |
| Minimum | 65.7% | 60.2% |
| Maximum | 100.0% | 100.0% |
| Range | 34.3% | 39.8% |
| Mean | 86.7% | 87.6% |
| Median | 85.6% | 85.8% |
| Interquartile 25% (IQ1) | 81.8% | 79.0% |
| Interquartile 75% (IQ3) | 94.7% | 100.0% |
| Interquartile Range (IQR) | 12.9% | 21.0% |
| Standard Deviation (Sample) | 8.8% | 9.8% |
| Standard Deviation (Population) | 8.7% | 9.8% |
Demographics Similar to Lebanese and Danes by In Labor Force | Age 30-34
In terms of in labor force | age 30-34, the demographic groups most similar to Lebanese are Bangladeshi (84.3%, a difference of 0.020%), Arab (84.3%, a difference of 0.030%), Jamaican (84.3%, a difference of 0.040%), Indonesian (84.3%, a difference of 0.040%), and Japanese (84.3%, a difference of 0.040%). Similarly, the demographic groups most similar to Danes are Swiss (84.3%, a difference of 0.020%), Immigrants from Panama (84.3%, a difference of 0.030%), Immigrants from Trinidad and Tobago (84.3%, a difference of 0.050%), Immigrants from Germany (84.3%, a difference of 0.060%), and European (84.3%, a difference of 0.060%).
| Demographics | Rating | Rank | In Labor Force | Age 30-34 |
| Canadians | 15.4 /100 | #203 | Poor 84.4% |
| Ecuadorians | 14.2 /100 | #204 | Poor 84.4% |
| French | 13.8 /100 | #205 | Poor 84.4% |
| Lebanese | 10.6 /100 | #206 | Poor 84.4% |
| Bangladeshis | 9.4 /100 | #207 | Tragic 84.3% |
| Arabs | 8.9 /100 | #208 | Tragic 84.3% |
| Jamaicans | 8.8 /100 | #209 | Tragic 84.3% |
| Indonesians | 8.8 /100 | #210 | Tragic 84.3% |
| Japanese | 8.8 /100 | #211 | Tragic 84.3% |
| Immigrants | Western Asia | 8.2 /100 | #212 | Tragic 84.3% |
| Immigrants | Jamaica | 7.9 /100 | #213 | Tragic 84.3% |
| Immigrants | Germany | 7.2 /100 | #214 | Tragic 84.3% |
| Europeans | 7.2 /100 | #215 | Tragic 84.3% |
| Immigrants | Ecuador | 7.1 /100 | #216 | Tragic 84.3% |
| Immigrants | Trinidad and Tobago | 7.0 /100 | #217 | Tragic 84.3% |
| Immigrants | Panama | 6.3 /100 | #218 | Tragic 84.3% |
| Swiss | 5.8 /100 | #219 | Tragic 84.3% |
| Danes | 5.3 /100 | #220 | Tragic 84.3% |
| Salvadorans | 3.8 /100 | #221 | Tragic 84.2% |
| Panamanians | 3.8 /100 | #222 | Tragic 84.2% |
| Immigrants | Laos | 3.6 /100 | #223 | Tragic 84.2% |