Laotian vs Black/African American In Labor Force | Age 45-54
COMPARE
Laotian
Black/African American
In Labor Force | Age 45-54
In Labor Force | Age 45-54 Comparison
Laotians
Blacks/African Americans
82.9%
IN LABOR FORCE | AGE 45-54
62.8/ 100
METRIC RATING
160th/ 347
METRIC RANK
79.3%
IN LABOR FORCE | AGE 45-54
0.0/ 100
METRIC RATING
315th/ 347
METRIC RANK
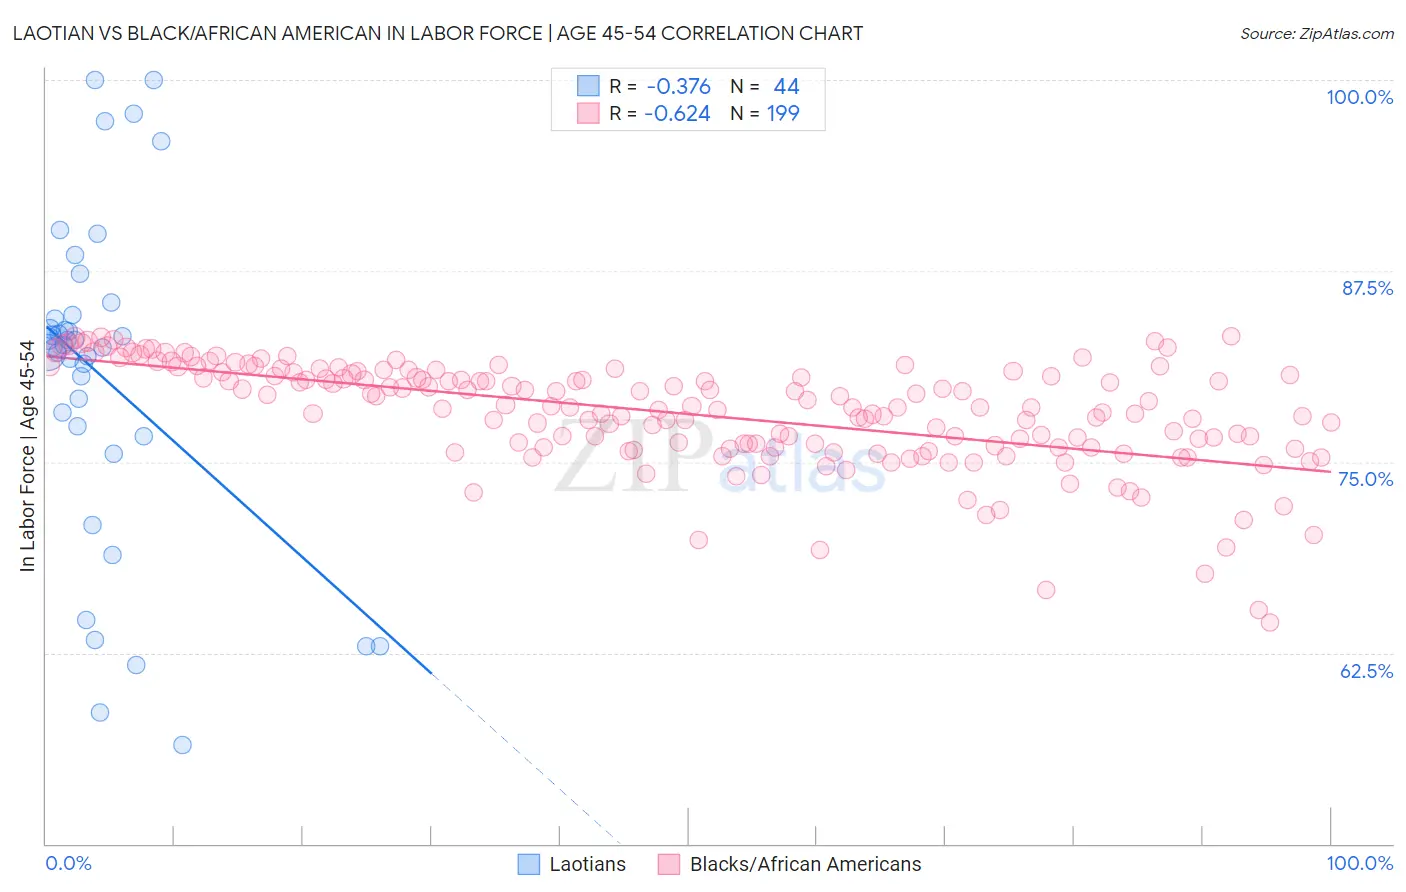
Laotian vs Black/African American In Labor Force | Age 45-54 Correlation Chart
The statistical analysis conducted on geographies consisting of 224,742,074 people shows a mild negative correlation between the proportion of Laotians and labor force participation rate among population between the ages 45 and 54 in the United States with a correlation coefficient (R) of -0.376 and weighted average of 82.9%. Similarly, the statistical analysis conducted on geographies consisting of 565,123,910 people shows a significant negative correlation between the proportion of Blacks/African Americans and labor force participation rate among population between the ages 45 and 54 in the United States with a correlation coefficient (R) of -0.624 and weighted average of 79.3%, a difference of 4.4%.
In Labor Force | Age 45-54 Correlation Summary
| Measurement | Laotian | Black/African American |
| Minimum | 56.5% | 64.5% |
| Maximum | 100.0% | 83.2% |
| Range | 43.5% | 18.7% |
| Mean | 80.6% | 78.1% |
| Median | 82.6% | 78.6% |
| Interquartile 25% (IQ1) | 77.0% | 75.9% |
| Interquartile 75% (IQ3) | 84.5% | 80.8% |
| Interquartile Range (IQR) | 7.5% | 4.9% |
| Standard Deviation (Sample) | 10.7% | 3.5% |
| Standard Deviation (Population) | 10.5% | 3.5% |
Similar Demographics by In Labor Force | Age 45-54
Demographics Similar to Laotians by In Labor Force | Age 45-54
In terms of in labor force | age 45-54, the demographic groups most similar to Laotians are South American Indian (82.9%, a difference of 0.010%), Haitian (82.8%, a difference of 0.010%), Dutch (82.8%, a difference of 0.010%), German Russian (82.8%, a difference of 0.010%), and Immigrants from Austria (82.9%, a difference of 0.020%).
| Demographics | Rating | Rank | In Labor Force | Age 45-54 |
| Immigrants | Indonesia | 70.6 /100 | #153 | Good 82.9% |
| Immigrants | Ghana | 70.3 /100 | #154 | Good 82.9% |
| Immigrants | Philippines | 69.0 /100 | #155 | Good 82.9% |
| Immigrants | Saudi Arabia | 68.8 /100 | #156 | Good 82.9% |
| Immigrants | Australia | 68.2 /100 | #157 | Good 82.9% |
| Immigrants | Southern Europe | 67.8 /100 | #158 | Good 82.9% |
| Immigrants | Austria | 64.6 /100 | #159 | Good 82.9% |
| Laotians | 62.8 /100 | #160 | Good 82.9% |
| South American Indians | 62.2 /100 | #161 | Good 82.9% |
| Haitians | 61.8 /100 | #162 | Good 82.8% |
| Dutch | 61.7 /100 | #163 | Good 82.8% |
| German Russians | 61.3 /100 | #164 | Good 82.8% |
| Immigrants | Sudan | 59.9 /100 | #165 | Average 82.8% |
| Immigrants | South Eastern Asia | 57.4 /100 | #166 | Average 82.8% |
| Swiss | 56.5 /100 | #167 | Average 82.8% |
Demographics Similar to Blacks/African Americans by In Labor Force | Age 45-54
In terms of in labor force | age 45-54, the demographic groups most similar to Blacks/African Americans are Shoshone (79.3%, a difference of 0.080%), Ottawa (79.5%, a difference of 0.14%), Colville (79.5%, a difference of 0.17%), Comanche (79.2%, a difference of 0.22%), and Chickasaw (79.0%, a difference of 0.39%).
| Demographics | Rating | Rank | In Labor Force | Age 45-54 |
| Central American Indians | 0.0 /100 | #308 | Tragic 80.0% |
| Potawatomi | 0.0 /100 | #309 | Tragic 80.0% |
| Inupiat | 0.0 /100 | #310 | Tragic 79.9% |
| Mexicans | 0.0 /100 | #311 | Tragic 79.8% |
| Immigrants | Mexico | 0.0 /100 | #312 | Tragic 79.7% |
| Colville | 0.0 /100 | #313 | Tragic 79.5% |
| Ottawa | 0.0 /100 | #314 | Tragic 79.5% |
| Blacks/African Americans | 0.0 /100 | #315 | Tragic 79.3% |
| Shoshone | 0.0 /100 | #316 | Tragic 79.3% |
| Comanche | 0.0 /100 | #317 | Tragic 79.2% |
| Chickasaw | 0.0 /100 | #318 | Tragic 79.0% |
| Cherokee | 0.0 /100 | #319 | Tragic 79.0% |
| Yaqui | 0.0 /100 | #320 | Tragic 78.9% |
| Yup'ik | 0.0 /100 | #321 | Tragic 78.6% |
| Crow | 0.0 /100 | #322 | Tragic 78.3% |