Kiowa vs Immigrants from Yemen In Labor Force | Age 30-34
COMPARE
Kiowa
Immigrants from Yemen
In Labor Force | Age 30-34
In Labor Force | Age 30-34 Comparison
Kiowa
Immigrants from Yemen
79.8%
IN LABOR FORCE | AGE 30-34
0.0/ 100
METRIC RATING
332nd/ 347
METRIC RANK
78.2%
IN LABOR FORCE | AGE 30-34
0.0/ 100
METRIC RATING
341st/ 347
METRIC RANK
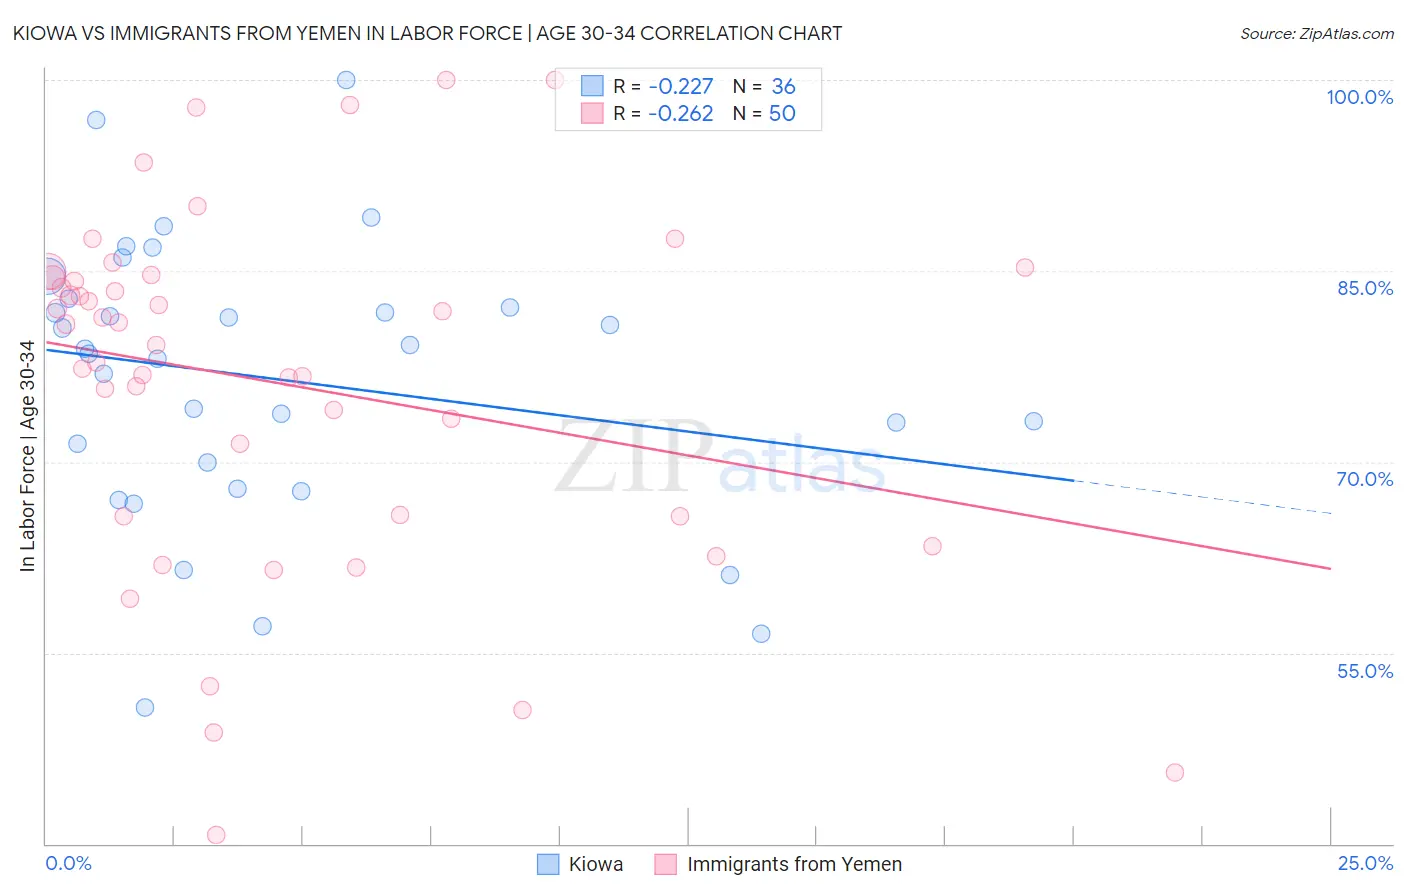
Kiowa vs Immigrants from Yemen In Labor Force | Age 30-34 Correlation Chart
The statistical analysis conducted on geographies consisting of 56,095,745 people shows a weak negative correlation between the proportion of Kiowa and labor force participation rate among population between the ages 30 and 34 in the United States with a correlation coefficient (R) of -0.227 and weighted average of 79.8%. Similarly, the statistical analysis conducted on geographies consisting of 82,432,494 people shows a weak negative correlation between the proportion of Immigrants from Yemen and labor force participation rate among population between the ages 30 and 34 in the United States with a correlation coefficient (R) of -0.262 and weighted average of 78.2%, a difference of 2.1%.
In Labor Force | Age 30-34 Correlation Summary
| Measurement | Kiowa | Immigrants from Yemen |
| Minimum | 50.7% | 40.7% |
| Maximum | 100.0% | 100.0% |
| Range | 49.3% | 59.3% |
| Mean | 76.5% | 76.2% |
| Median | 78.7% | 80.0% |
| Interquartile 25% (IQ1) | 69.0% | 65.7% |
| Interquartile 75% (IQ3) | 82.5% | 84.4% |
| Interquartile Range (IQR) | 13.5% | 18.7% |
| Standard Deviation (Sample) | 11.0% | 13.9% |
| Standard Deviation (Population) | 10.8% | 13.8% |
Demographics Similar to Kiowa and Immigrants from Yemen by In Labor Force | Age 30-34
In terms of in labor force | age 30-34, the demographic groups most similar to Kiowa are Houma (79.9%, a difference of 0.11%), Inupiat (79.7%, a difference of 0.12%), Pueblo (80.0%, a difference of 0.28%), Creek (80.4%, a difference of 0.68%), and Sioux (80.4%, a difference of 0.69%). Similarly, the demographic groups most similar to Immigrants from Yemen are Tohono O'odham (77.7%, a difference of 0.57%), Ute (78.9%, a difference of 0.98%), Apache (79.0%, a difference of 1.1%), Pima (79.0%, a difference of 1.1%), and Lumbee (77.3%, a difference of 1.2%).
| Demographics | Rating | Rank | In Labor Force | Age 30-34 |
| Seminole | 0.0 /100 | #326 | Tragic 80.8% |
| Colville | 0.0 /100 | #327 | Tragic 80.7% |
| Sioux | 0.0 /100 | #328 | Tragic 80.4% |
| Creek | 0.0 /100 | #329 | Tragic 80.4% |
| Pueblo | 0.0 /100 | #330 | Tragic 80.0% |
| Houma | 0.0 /100 | #331 | Tragic 79.9% |
| Kiowa | 0.0 /100 | #332 | Tragic 79.8% |
| Inupiat | 0.0 /100 | #333 | Tragic 79.7% |
| Hopi | 0.0 /100 | #334 | Tragic 79.3% |
| Marshallese | 0.0 /100 | #335 | Tragic 79.2% |
| Natives/Alaskans | 0.0 /100 | #336 | Tragic 79.2% |
| Yakama | 0.0 /100 | #337 | Tragic 79.1% |
| Pima | 0.0 /100 | #338 | Tragic 79.0% |
| Apache | 0.0 /100 | #339 | Tragic 79.0% |
| Ute | 0.0 /100 | #340 | Tragic 78.9% |
| Immigrants | Yemen | 0.0 /100 | #341 | Tragic 78.2% |
| Tohono O'odham | 0.0 /100 | #342 | Tragic 77.7% |
| Lumbee | 0.0 /100 | #343 | Tragic 77.3% |
| Yuman | 0.0 /100 | #344 | Tragic 77.1% |
| Yup'ik | 0.0 /100 | #345 | Tragic 76.4% |
| Crow | 0.0 /100 | #346 | Tragic 75.9% |