Kenyan vs Immigrants from Croatia In Labor Force | Age 30-34

COMPARE

Kenyan
Race
Ancestry
AfghanAfricanAlaska NativeAlaskan AthabascanAlbanianAleutAlsatianAmericanApacheArabArapahoArgentineanArmenianAssyrian/Chaldean/SyriacAustralianAustrianBahamianBangladeshiBarbadianBasqueBelgianBelizeanBermudanBhutaneseBlackfeetBolivianBrazilianBritishBritish West IndianBulgarianBurmeseCajunCambodianCanadianCape VerdeanCarpatho RusynCelticCentral AmericanCentral American IndianCherokeeCheyenneChickasawChileanChineseChippewaChoctawColombianColvilleComancheCosta RicanCreeCreekCroatianCrowCubanCypriotCzechCzechoslovakianDanishDelawareDominicanDutchDutch West IndianEastern EuropeanEcuadorianEgyptianEnglishEstonianEthiopianEuropeanFijianFilipinoFinnishFrenchFrench American IndianFrench CanadianGermanGerman RussianGhanaianGreekGuamanian/ChamorroGuatemalanGuyaneseHaitianHmongHonduranHopiHoumaHungarianIcelanderIndian (Asian)IndonesianInupiatIranianIraqiIrishIroquoisIsraeliItalianJamaicanJapaneseJordanianKenyanKiowaKoreanLaotianLatvianLebaneseLiberianLithuanianLumbeeLuxembourgerMacedonianMalaysianMalteseMarshalleseMenomineeMexicanMexican American IndianMongolianMoroccanNative HawaiianNavajoNepaleseNew ZealanderNicaraguanNigerianNorthern EuropeanNorwegianOkinawanOsageOttawaPaiutePakistaniPalestinianPanamanianParaguayanPennsylvania GermanPeruvianPimaPolishPortuguesePotawatomiPuebloPuerto RicanPuget Sound SalishRomanianRussianSalvadoranSamoanScandinavianScotch-IrishScottishSeminoleSenegaleseSerbianShoshoneSierra LeoneanSiouxSlavicSlovakSloveneSomaliSouth AfricanSouth AmericanSouth American IndianSoviet UnionSpaniardSpanishSpanish AmericanSpanish American IndianSri LankanSubsaharan AfricanSudaneseSwedishSwissSyrianTaiwaneseThaiTlingit-HaidaTohono O'OdhamTonganTrinidadian and TobagonianTsimshianTurkishU.S. Virgin IslanderUgandanUkrainianUruguayanUteVenezuelanVietnameseWelshWest IndianYakamaYaquiYugoslavianYumanYup'ikZimbabwean
Immigration
NonimmigrantsImmigrantsAfghanistanAfricaAlbaniaArgentinaArmeniaAsiaAustraliaAustriaBahamasBangladeshBarbadosBelarusBelgiumBelizeBoliviaBosnia and HerzegovinaBrazilBulgariaBurma/MyanmarCabo VerdeCambodiaCameroonCanadaCaribbeanCentral AmericaChileChinaColombiaCongoCosta RicaCubaCzechoslovakiaDenmarkDominicaDominican RepublicEastern AfricaEastern AsiaEastern EuropeEcuadorEgyptEl SalvadorEnglandEritreaEthiopiaEuropeFijiFranceGermanyGhanaGreeceGrenadaGuatemalaGuyanaHaitiHondurasHong KongHungaryIndiaIndonesiaIranIraqIrelandIsraelItalyJamaicaJapanJordanKazakhstanKenyaKoreaKuwaitLaosLatin AmericaLatviaLebanonLiberiaLithuaniaMalaysiaMexicoMicronesiaMiddle AfricaMoldovaMoroccoNepalNetherlandsNicaraguaNigeriaNorth AmericaNorth MacedoniaNorthern AfricaNorthern EuropeNorwayOceaniaPakistanPanamaPeruPhilippinesPolandPortugalRomaniaRussiaSaudi ArabiaScotlandSenegalSerbiaSierra LeoneSingaporeSomaliaSouth AfricaSouth AmericaSouth Central AsiaSouth Eastern AsiaSouthern EuropeSpainSri LankaSt. Vincent and the GrenadinesSudanSwedenSwitzerlandSyriaTaiwanThailandTrinidad and TobagoTurkeyUgandaUkraineUruguayUzbekistanVenezuelaVietnamWest IndiesWestern AfricaWestern AsiaWestern EuropeYemenZaireZimbabweAzores
Immigrants from Croatia
Race
Ancestry
AfghanAfricanAlaska NativeAlaskan AthabascanAlbanianAleutAlsatianAmericanApacheArabArapahoArgentineanArmenianAssyrian/Chaldean/SyriacAustralianAustrianBahamianBangladeshiBarbadianBasqueBelgianBelizeanBermudanBhutaneseBlackfeetBolivianBrazilianBritishBritish West IndianBulgarianBurmeseCajunCambodianCanadianCape VerdeanCarpatho RusynCelticCentral AmericanCentral American IndianCherokeeCheyenneChickasawChileanChineseChippewaChoctawColombianColvilleComancheCosta RicanCreeCreekCroatianCrowCubanCypriotCzechCzechoslovakianDanishDelawareDominicanDutchDutch West IndianEastern EuropeanEcuadorianEgyptianEnglishEstonianEthiopianEuropeanFijianFilipinoFinnishFrenchFrench American IndianFrench CanadianGermanGerman RussianGhanaianGreekGuamanian/ChamorroGuatemalanGuyaneseHaitianHmongHonduranHopiHoumaHungarianIcelanderIndian (Asian)IndonesianInupiatIranianIraqiIrishIroquoisIsraeliItalianJamaicanJapaneseJordanianKiowaKoreanLaotianLatvianLebaneseLiberianLithuanianLumbeeLuxembourgerMacedonianMalaysianMalteseMarshalleseMenomineeMexicanMexican American IndianMongolianMoroccanNative HawaiianNavajoNepaleseNew ZealanderNicaraguanNigerianNorthern EuropeanNorwegianOkinawanOsageOttawaPaiutePakistaniPalestinianPanamanianParaguayanPennsylvania GermanPeruvianPimaPolishPortuguesePotawatomiPuebloPuerto RicanPuget Sound SalishRomanianRussianSalvadoranSamoanScandinavianScotch-IrishScottishSeminoleSenegaleseSerbianShoshoneSierra LeoneanSiouxSlavicSlovakSloveneSomaliSouth AfricanSouth AmericanSouth American IndianSoviet UnionSpaniardSpanishSpanish AmericanSpanish American IndianSri LankanSubsaharan AfricanSudaneseSwedishSwissSyrianTaiwaneseThaiTlingit-HaidaTohono O'OdhamTonganTrinidadian and TobagonianTsimshianTurkishU.S. Virgin IslanderUgandanUkrainianUruguayanUteVenezuelanVietnameseWelshWest IndianYakamaYaquiYugoslavianYumanYup'ikZimbabwean
Immigration
NonimmigrantsImmigrantsAfghanistanAfricaAlbaniaArgentinaArmeniaAsiaAustraliaAustriaBahamasBangladeshBarbadosBelarusBelgiumBelizeBoliviaBosnia and HerzegovinaBrazilBulgariaBurma/MyanmarCabo VerdeCambodiaCameroonCanadaCaribbeanCentral AmericaChileChinaColombiaCongoCosta RicaCroatiaCubaCzechoslovakiaDenmarkDominicaDominican RepublicEastern AfricaEastern AsiaEastern EuropeEcuadorEgyptEl SalvadorEnglandEritreaEthiopiaEuropeFijiFranceGermanyGhanaGreeceGrenadaGuatemalaGuyanaHaitiHondurasHong KongHungaryIndiaIndonesiaIranIraqIrelandIsraelItalyJamaicaJapanJordanKazakhstanKenyaKoreaKuwaitLaosLatin AmericaLatviaLebanonLiberiaLithuaniaMalaysiaMexicoMicronesiaMiddle AfricaMoldovaMoroccoNepalNetherlandsNicaraguaNigeriaNorth AmericaNorth MacedoniaNorthern AfricaNorthern EuropeNorwayOceaniaPakistanPanamaPeruPhilippinesPolandPortugalRomaniaRussiaSaudi ArabiaScotlandSenegalSerbiaSierra LeoneSingaporeSomaliaSouth AfricaSouth AmericaSouth Central AsiaSouth Eastern AsiaSouthern EuropeSpainSri LankaSt. Vincent and the GrenadinesSudanSwedenSwitzerlandSyriaTaiwanThailandTrinidad and TobagoTurkeyUgandaUkraineUruguayUzbekistanVenezuelaVietnamWest IndiesWestern AfricaWestern AsiaWestern EuropeYemenZaireZimbabweAzores
In Labor Force | Age 30-34
Income
Poverty
Unemployment
Labor Participation
Family Structure
Vehicle Availability
Education Level
Disability

In Labor Force | Age 30-34 Comparison

Kenyans

Immigrants from Croatia

Exceptional
Exceptional
85.4%
IN LABOR FORCE | AGE 30-34
99.3/ 100
METRIC RATING
67th/ 347
METRIC RANK
86.1%
IN LABOR FORCE | AGE 30-34
100.0/ 100
METRIC RATING
13th/ 347
METRIC RANK

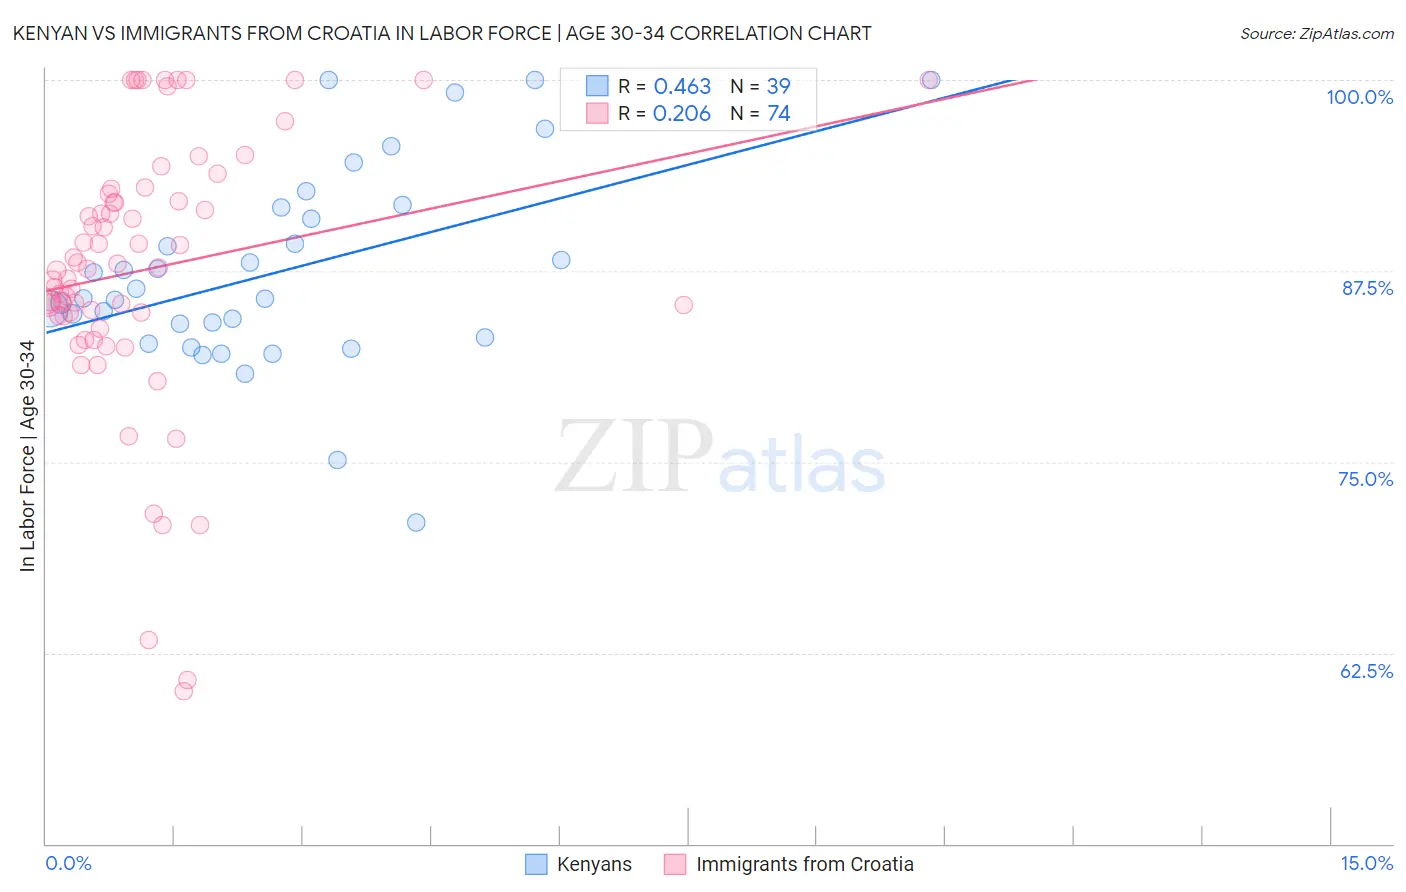
Kenyan vs Immigrants from Croatia In Labor Force | Age 30-34 Correlation Chart

The statistical analysis conducted on geographies consisting of 168,200,572 people shows a moderate positive correlation between the proportion of Kenyans and labor force participation rate among population between the ages 30 and 34 in the United States with a correlation coefficient (R) of 0.463 and weighted average of 85.4%. Similarly, the statistical analysis conducted on geographies consisting of 132,558,234 people shows a weak positive correlation between the proportion of Immigrants from Croatia and labor force participation rate among population between the ages 30 and 34 in the United States with a correlation coefficient (R) of 0.206 and weighted average of 86.1%, a difference of 0.78%.
Kenyan vs Immigrants from Croatia In Labor Force | Age 30-34

In Labor Force | Age 30-34 Correlation Summary

MeasurementKenyanImmigrants from Croatia
Minimum71.0%60.0%
Maximum100.0%100.0%
Range29.0%40.0%
Mean87.4%87.6%
Median85.7%87.7%
Interquartile 25% (IQ1)83.1%84.6%
Interquartile 75% (IQ3)91.6%92.6%
Interquartile Range (IQR)8.5%8.0%
Standard Deviation (Sample)6.5%8.8%
Standard Deviation (Population)6.4%8.8%

Similar Demographics by In Labor Force | Age 30-34

Demographics Similar to Kenyans by In Labor Force | Age 30-34

In terms of in labor force | age 30-34, the demographic groups most similar to Kenyans are Ghanaian (85.4%, a difference of 0.0%), Senegalese (85.4%, a difference of 0.010%), Immigrants from Eastern Europe (85.4%, a difference of 0.010%), Italian (85.4%, a difference of 0.020%), and Soviet Union (85.5%, a difference of 0.030%).
DemographicsRating | RankIn Labor Force | Age 30-34
Immigrants | France
99.5
/100
|
#60
Exceptional
85.5%
Immigrants | Brazil
99.5
/100
|
#61
Exceptional
85.5%
Soviet Union
99.4
/100
|
#62
Exceptional
85.5%
Macedonians
99.4
/100
|
#63
Exceptional
85.5%
Italians
99.4
/100
|
#64
Exceptional
85.4%
Senegalese
99.4
/100
|
#65
Exceptional
85.4%
Ghanaians
99.4
/100
|
#66
Exceptional
85.4%
Kenyans
99.3
/100
|
#67
Exceptional
85.4%
Immigrants | Eastern Europe
99.3
/100
|
#68
Exceptional
85.4%
Immigrants | Iran
99.2
/100
|
#69
Exceptional
85.4%
Brazilians
99.1
/100
|
#70
Exceptional
85.4%
Immigrants | Japan
99.1
/100
|
#71
Exceptional
85.4%
Immigrants | China
99.0
/100
|
#72
Exceptional
85.4%
Indians (Asian)
99.0
/100
|
#73
Exceptional
85.4%
Maltese
99.0
/100
|
#74
Exceptional
85.4%

Demographics Similar to Immigrants from Croatia by In Labor Force | Age 30-34

In terms of in labor force | age 30-34, the demographic groups most similar to Immigrants from Croatia are Bolivian (86.1%, a difference of 0.0%), Immigrants from Cabo Verde (86.1%, a difference of 0.010%), Immigrants from Albania (86.1%, a difference of 0.030%), Latvian (86.0%, a difference of 0.060%), and Immigrants from Cameroon (86.0%, a difference of 0.060%).
DemographicsRating | RankIn Labor Force | Age 30-34
Somalis
100.0
/100
|
#6
Exceptional
86.2%
Immigrants | Bolivia
100.0
/100
|
#7
Exceptional
86.2%
Cambodians
100.0
/100
|
#8
Exceptional
86.2%
Immigrants | Somalia
100.0
/100
|
#9
Exceptional
86.2%
Immigrants | Serbia
100.0
/100
|
#10
Exceptional
86.2%
Carpatho Rusyns
100.0
/100
|
#11
Exceptional
86.2%
Bolivians
100.0
/100
|
#12
Exceptional
86.1%
Immigrants | Croatia
100.0
/100
|
#13
Exceptional
86.1%
Immigrants | Cabo Verde
100.0
/100
|
#14
Exceptional
86.1%
Immigrants | Albania
100.0
/100
|
#15
Exceptional
86.1%
Latvians
100.0
/100
|
#16
Exceptional
86.0%
Immigrants | Cameroon
100.0
/100
|
#17
Exceptional
86.0%
Immigrants | Sierra Leone
100.0
/100
|
#18
Exceptional
86.0%
Sierra Leoneans
100.0
/100
|
#19
Exceptional
86.0%
Bulgarians
100.0
/100
|
#20
Exceptional
86.0%