Italian vs Greek In Labor Force | Age 45-54
COMPARE
Italian
Greek
In Labor Force | Age 45-54
In Labor Force | Age 45-54 Comparison
Italians
Greeks
83.3%
IN LABOR FORCE | AGE 45-54
95.1/ 100
METRIC RATING
93rd/ 347
METRIC RANK
83.3%
IN LABOR FORCE | AGE 45-54
95.9/ 100
METRIC RATING
85th/ 347
METRIC RANK
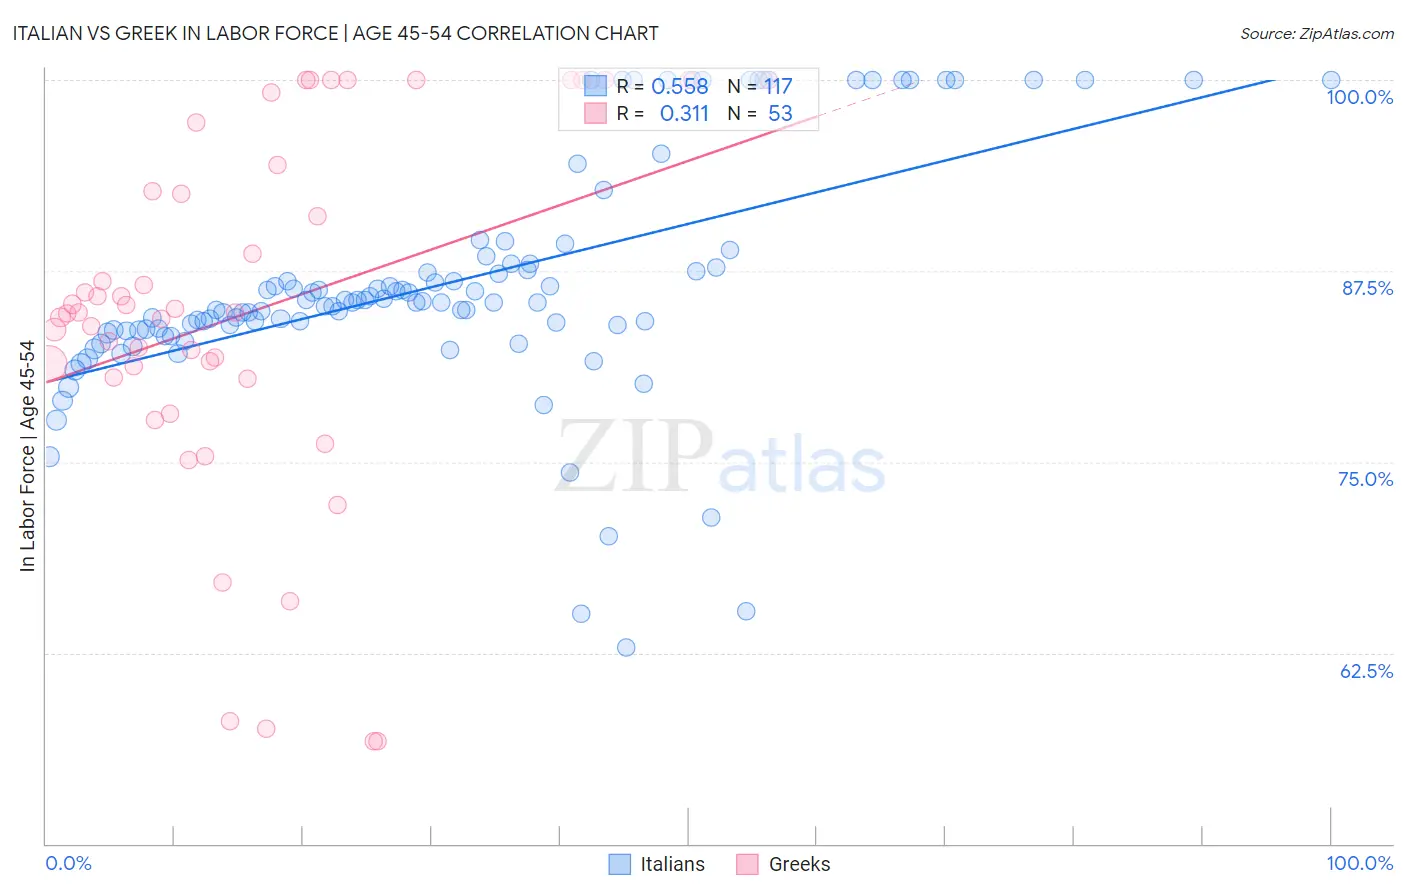
Italian vs Greek In Labor Force | Age 45-54 Correlation Chart
The statistical analysis conducted on geographies consisting of 574,249,528 people shows a substantial positive correlation between the proportion of Italians and labor force participation rate among population between the ages 45 and 54 in the United States with a correlation coefficient (R) of 0.558 and weighted average of 83.3%. Similarly, the statistical analysis conducted on geographies consisting of 482,326,237 people shows a mild positive correlation between the proportion of Greeks and labor force participation rate among population between the ages 45 and 54 in the United States with a correlation coefficient (R) of 0.311 and weighted average of 83.3%, a difference of 0.040%.
In Labor Force | Age 45-54 Correlation Summary
| Measurement | Italian | Greek |
| Minimum | 62.8% | 56.7% |
| Maximum | 100.0% | 100.0% |
| Range | 37.2% | 43.3% |
| Mean | 86.7% | 84.6% |
| Median | 85.4% | 84.8% |
| Interquartile 25% (IQ1) | 83.6% | 80.5% |
| Interquartile 75% (IQ3) | 87.9% | 93.6% |
| Interquartile Range (IQR) | 4.3% | 13.1% |
| Standard Deviation (Sample) | 7.7% | 11.8% |
| Standard Deviation (Population) | 7.6% | 11.7% |
Demographics Similar to Italians and Greeks by In Labor Force | Age 45-54
In terms of in labor force | age 45-54, the demographic groups most similar to Italians are Danish (83.3%, a difference of 0.010%), Argentinean (83.3%, a difference of 0.010%), Immigrants from Argentina (83.3%, a difference of 0.010%), Immigrants from Eastern Europe (83.3%, a difference of 0.020%), and Immigrants from Asia (83.3%, a difference of 0.020%). Similarly, the demographic groups most similar to Greeks are Immigrants from Bosnia and Herzegovina (83.3%, a difference of 0.010%), Immigrants from Northern Africa (83.3%, a difference of 0.010%), Immigrants from Eastern Asia (83.4%, a difference of 0.020%), Immigrants from Zimbabwe (83.4%, a difference of 0.020%), and Immigrants from Eastern Europe (83.3%, a difference of 0.020%).
| Demographics | Rating | Rank | In Labor Force | Age 45-54 |
| Belgians | 96.5 /100 | #79 | Exceptional 83.4% |
| Immigrants | Croatia | 96.5 /100 | #80 | Exceptional 83.4% |
| Jordanians | 96.4 /100 | #81 | Exceptional 83.4% |
| Immigrants | Eastern Asia | 96.3 /100 | #82 | Exceptional 83.4% |
| Immigrants | Zimbabwe | 96.3 /100 | #83 | Exceptional 83.4% |
| Immigrants | Bosnia and Herzegovina | 96.0 /100 | #84 | Exceptional 83.3% |
| Greeks | 95.9 /100 | #85 | Exceptional 83.3% |
| Immigrants | Northern Africa | 95.7 /100 | #86 | Exceptional 83.3% |
| Immigrants | Eastern Europe | 95.6 /100 | #87 | Exceptional 83.3% |
| Immigrants | Asia | 95.6 /100 | #88 | Exceptional 83.3% |
| Indians (Asian) | 95.5 /100 | #89 | Exceptional 83.3% |
| Immigrants | Japan | 95.5 /100 | #90 | Exceptional 83.3% |
| South Americans | 95.5 /100 | #91 | Exceptional 83.3% |
| Danes | 95.3 /100 | #92 | Exceptional 83.3% |
| Italians | 95.1 /100 | #93 | Exceptional 83.3% |
| Argentineans | 94.9 /100 | #94 | Exceptional 83.3% |
| Immigrants | Argentina | 94.9 /100 | #95 | Exceptional 83.3% |
| Immigrants | Kuwait | 94.8 /100 | #96 | Exceptional 83.3% |
| Palestinians | 94.8 /100 | #97 | Exceptional 83.3% |
| Maltese | 94.4 /100 | #98 | Exceptional 83.3% |
| Immigrants | Middle Africa | 94.3 /100 | #99 | Exceptional 83.3% |