Irish vs Immigrants from South Africa In Labor Force | Age 25-29
COMPARE
Irish
Immigrants from South Africa
In Labor Force | Age 25-29
In Labor Force | Age 25-29 Comparison
Irish
Immigrants from South Africa
85.0%
IN LABOR FORCE | AGE 25-29
90.6/ 100
METRIC RATING
113th/ 347
METRIC RANK
84.9%
IN LABOR FORCE | AGE 25-29
86.1/ 100
METRIC RATING
120th/ 347
METRIC RANK
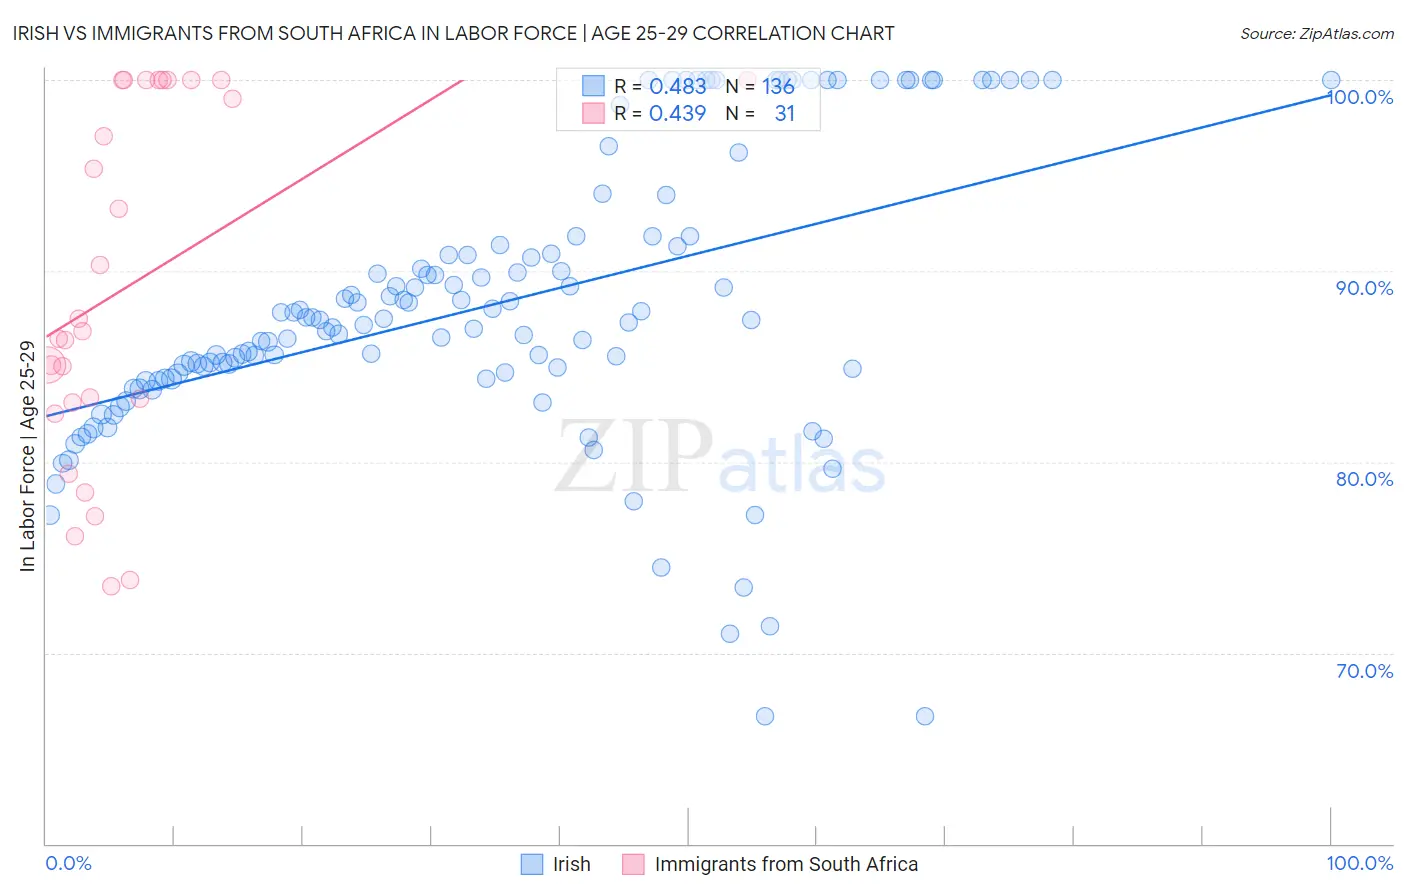
Irish vs Immigrants from South Africa In Labor Force | Age 25-29 Correlation Chart
The statistical analysis conducted on geographies consisting of 578,488,180 people shows a moderate positive correlation between the proportion of Irish and labor force participation rate among population between the ages 25 and 29 in the United States with a correlation coefficient (R) of 0.483 and weighted average of 85.0%. Similarly, the statistical analysis conducted on geographies consisting of 233,262,350 people shows a moderate positive correlation between the proportion of Immigrants from South Africa and labor force participation rate among population between the ages 25 and 29 in the United States with a correlation coefficient (R) of 0.439 and weighted average of 84.9%, a difference of 0.080%.
In Labor Force | Age 25-29 Correlation Summary
| Measurement | Irish | Immigrants from South Africa |
| Minimum | 66.7% | 73.5% |
| Maximum | 100.0% | 100.0% |
| Range | 33.3% | 26.5% |
| Mean | 88.2% | 89.3% |
| Median | 87.5% | 86.8% |
| Interquartile 25% (IQ1) | 84.3% | 83.1% |
| Interquartile 75% (IQ3) | 91.3% | 100.0% |
| Interquartile Range (IQR) | 7.0% | 16.9% |
| Standard Deviation (Sample) | 7.4% | 9.1% |
| Standard Deviation (Population) | 7.4% | 9.0% |
Demographics Similar to Irish and Immigrants from South Africa by In Labor Force | Age 25-29
In terms of in labor force | age 25-29, the demographic groups most similar to Irish are Senegalese (85.0%, a difference of 0.010%), Immigrants from Malaysia (85.0%, a difference of 0.010%), New Zealander (85.0%, a difference of 0.020%), Immigrants from Middle Africa (85.0%, a difference of 0.020%), and Immigrants from Austria (85.0%, a difference of 0.030%). Similarly, the demographic groups most similar to Immigrants from South Africa are Immigrants from Chile (84.9%, a difference of 0.010%), Scandinavian (84.9%, a difference of 0.010%), Filipino (84.9%, a difference of 0.020%), Dutch (84.9%, a difference of 0.020%), and Immigrants from Iran (84.9%, a difference of 0.020%).
| Demographics | Rating | Rank | In Labor Force | Age 25-29 |
| Czechoslovakians | 92.6 /100 | #106 | Exceptional 85.0% |
| Immigrants | Southern Europe | 92.3 /100 | #107 | Exceptional 85.0% |
| Immigrants | Austria | 91.9 /100 | #108 | Exceptional 85.0% |
| Costa Ricans | 91.9 /100 | #109 | Exceptional 85.0% |
| New Zealanders | 91.5 /100 | #110 | Exceptional 85.0% |
| Immigrants | Middle Africa | 91.4 /100 | #111 | Exceptional 85.0% |
| Senegalese | 90.9 /100 | #112 | Exceptional 85.0% |
| Irish | 90.6 /100 | #113 | Exceptional 85.0% |
| Immigrants | Malaysia | 90.4 /100 | #114 | Exceptional 85.0% |
| South Africans | 88.9 /100 | #115 | Excellent 85.0% |
| Chileans | 88.8 /100 | #116 | Excellent 85.0% |
| Immigrants | Belarus | 88.0 /100 | #117 | Excellent 85.0% |
| Finns | 87.8 /100 | #118 | Excellent 85.0% |
| Filipinos | 87.1 /100 | #119 | Excellent 84.9% |
| Immigrants | South Africa | 86.1 /100 | #120 | Excellent 84.9% |
| Immigrants | Chile | 85.6 /100 | #121 | Excellent 84.9% |
| Scandinavians | 85.1 /100 | #122 | Excellent 84.9% |
| Dutch | 84.9 /100 | #123 | Excellent 84.9% |
| Immigrants | Iran | 84.8 /100 | #124 | Excellent 84.9% |
| Uruguayans | 84.7 /100 | #125 | Excellent 84.9% |
| Immigrants | Singapore | 84.4 /100 | #126 | Excellent 84.9% |