Irish vs Immigrants from Greece In Labor Force | Age 35-44
COMPARE
Irish
Immigrants from Greece
In Labor Force | Age 35-44
In Labor Force | Age 35-44 Comparison
Irish
Immigrants from Greece
84.4%
IN LABOR FORCE | AGE 35-44
53.1/ 100
METRIC RATING
168th/ 347
METRIC RANK
85.3%
IN LABOR FORCE | AGE 35-44
99.9/ 100
METRIC RATING
28th/ 347
METRIC RANK
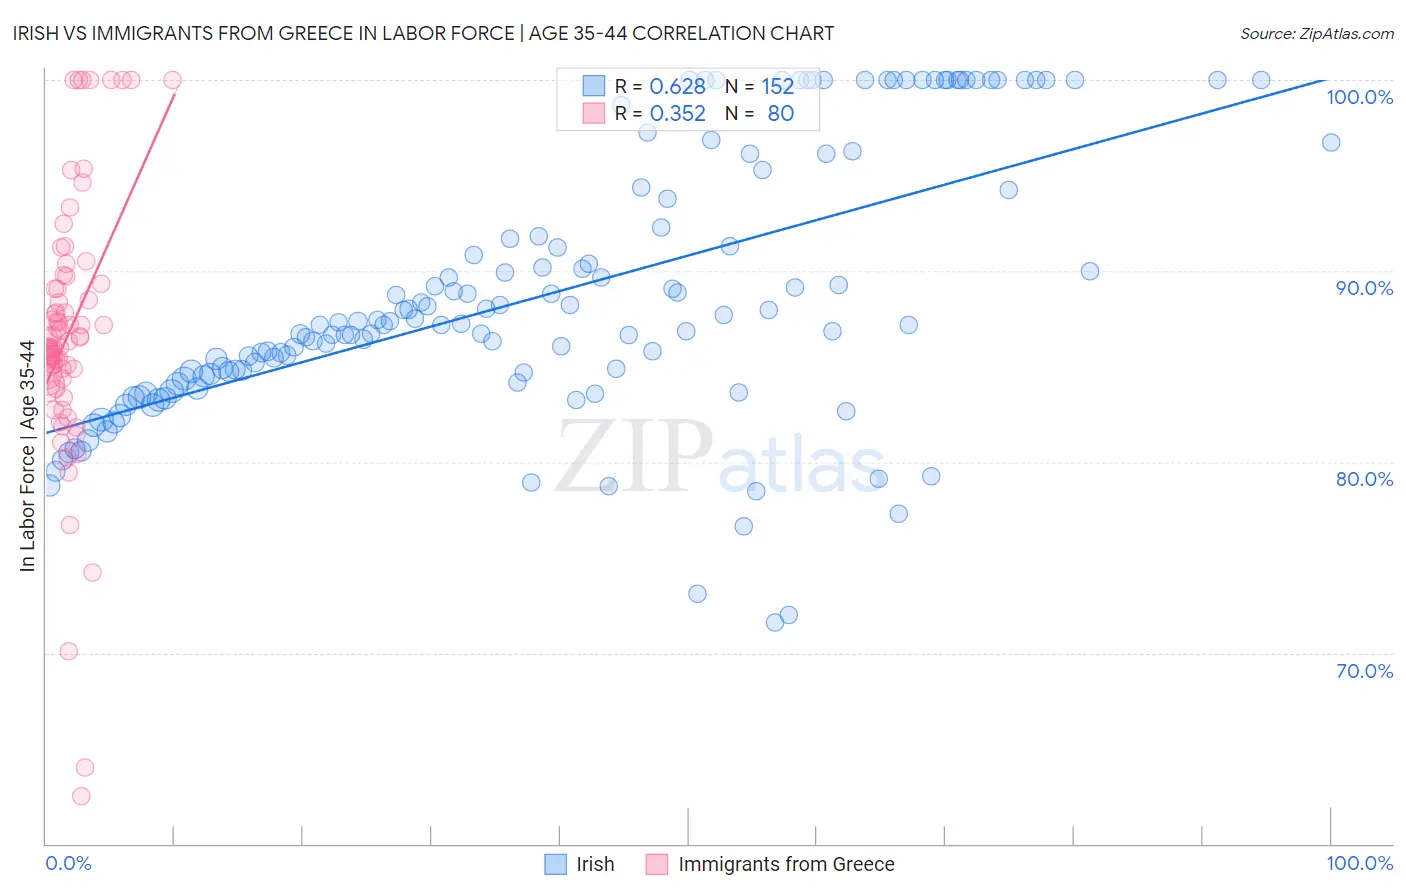
Irish vs Immigrants from Greece In Labor Force | Age 35-44 Correlation Chart
The statistical analysis conducted on geographies consisting of 579,649,730 people shows a significant positive correlation between the proportion of Irish and labor force participation rate among population between the ages 35 and 44 in the United States with a correlation coefficient (R) of 0.628 and weighted average of 84.4%. Similarly, the statistical analysis conducted on geographies consisting of 216,859,969 people shows a mild positive correlation between the proportion of Immigrants from Greece and labor force participation rate among population between the ages 35 and 44 in the United States with a correlation coefficient (R) of 0.352 and weighted average of 85.3%, a difference of 1.1%.
In Labor Force | Age 35-44 Correlation Summary
| Measurement | Irish | Immigrants from Greece |
| Minimum | 71.6% | 62.5% |
| Maximum | 100.0% | 100.0% |
| Range | 28.4% | 37.5% |
| Mean | 88.8% | 86.7% |
| Median | 87.2% | 86.2% |
| Interquartile 25% (IQ1) | 84.4% | 84.2% |
| Interquartile 75% (IQ3) | 94.0% | 89.2% |
| Interquartile Range (IQR) | 9.6% | 4.9% |
| Standard Deviation (Sample) | 7.0% | 7.0% |
| Standard Deviation (Population) | 6.9% | 6.9% |
Similar Demographics by In Labor Force | Age 35-44
Demographics Similar to Irish by In Labor Force | Age 35-44
In terms of in labor force | age 35-44, the demographic groups most similar to Irish are Immigrants from Afghanistan (84.4%, a difference of 0.0%), Immigrants from Jordan (84.4%, a difference of 0.0%), Alsatian (84.4%, a difference of 0.010%), Immigrants from Portugal (84.4%, a difference of 0.010%), and Jordanian (84.4%, a difference of 0.010%).
| Demographics | Rating | Rank | In Labor Force | Age 35-44 |
| Immigrants | Venezuela | 60.0 /100 | #161 | Good 84.4% |
| Immigrants | Hungary | 59.4 /100 | #162 | Average 84.4% |
| Aleuts | 59.1 /100 | #163 | Average 84.4% |
| Nigerians | 58.9 /100 | #164 | Average 84.4% |
| Venezuelans | 58.1 /100 | #165 | Average 84.4% |
| Alsatians | 55.2 /100 | #166 | Average 84.4% |
| Immigrants | Portugal | 55.2 /100 | #167 | Average 84.4% |
| Irish | 53.1 /100 | #168 | Average 84.4% |
| Immigrants | Afghanistan | 52.7 /100 | #169 | Average 84.4% |
| Immigrants | Jordan | 52.5 /100 | #170 | Average 84.4% |
| Jordanians | 51.7 /100 | #171 | Average 84.4% |
| Scandinavians | 51.2 /100 | #172 | Average 84.4% |
| Immigrants | Trinidad and Tobago | 50.7 /100 | #173 | Average 84.4% |
| Immigrants | Iran | 50.0 /100 | #174 | Average 84.4% |
| Pakistanis | 48.2 /100 | #175 | Average 84.4% |
Demographics Similar to Immigrants from Greece by In Labor Force | Age 35-44
In terms of in labor force | age 35-44, the demographic groups most similar to Immigrants from Greece are Immigrants from Lithuania (85.4%, a difference of 0.010%), Paraguayan (85.4%, a difference of 0.020%), Immigrants from Liberia (85.4%, a difference of 0.020%), Latvian (85.4%, a difference of 0.030%), and Cambodian (85.3%, a difference of 0.040%).
| Demographics | Rating | Rank | In Labor Force | Age 35-44 |
| Bulgarians | 100.0 /100 | #21 | Exceptional 85.5% |
| Immigrants | Bosnia and Herzegovina | 100.0 /100 | #22 | Exceptional 85.4% |
| Immigrants | Eastern Africa | 100.0 /100 | #23 | Exceptional 85.4% |
| Latvians | 99.9 /100 | #24 | Exceptional 85.4% |
| Paraguayans | 99.9 /100 | #25 | Exceptional 85.4% |
| Immigrants | Liberia | 99.9 /100 | #26 | Exceptional 85.4% |
| Immigrants | Lithuania | 99.9 /100 | #27 | Exceptional 85.4% |
| Immigrants | Greece | 99.9 /100 | #28 | Exceptional 85.3% |
| Cambodians | 99.9 /100 | #29 | Exceptional 85.3% |
| Bermudans | 99.9 /100 | #30 | Exceptional 85.3% |
| Czechs | 99.9 /100 | #31 | Exceptional 85.3% |
| Immigrants | India | 99.9 /100 | #32 | Exceptional 85.3% |
| Ugandans | 99.9 /100 | #33 | Exceptional 85.3% |
| Immigrants | Nepal | 99.9 /100 | #34 | Exceptional 85.3% |
| Estonians | 99.9 /100 | #35 | Exceptional 85.3% |