Iraqi vs Egyptian In Labor Force | Age 20-24
COMPARE
Iraqi
Egyptian
In Labor Force | Age 20-24
In Labor Force | Age 20-24 Comparison
Iraqis
Egyptians
76.0%
IN LABOR FORCE | AGE 20-24
96.6/ 100
METRIC RATING
108th/ 347
METRIC RANK
73.7%
IN LABOR FORCE | AGE 20-24
0.7/ 100
METRIC RATING
258th/ 347
METRIC RANK
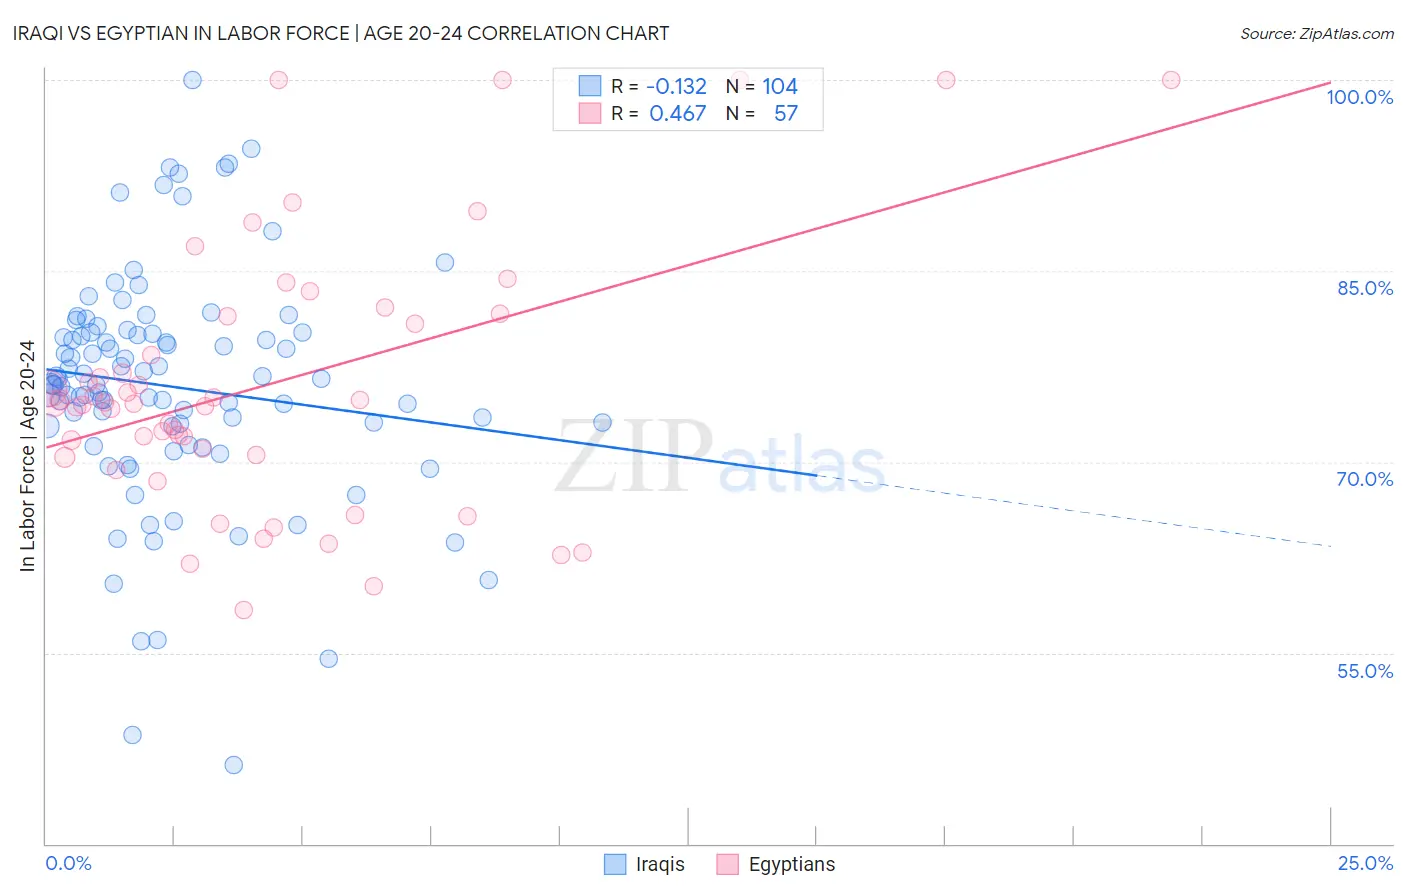
Iraqi vs Egyptian In Labor Force | Age 20-24 Correlation Chart
The statistical analysis conducted on geographies consisting of 170,641,378 people shows a poor negative correlation between the proportion of Iraqis and labor force participation rate among population between the ages 20 and 24 in the United States with a correlation coefficient (R) of -0.132 and weighted average of 76.0%. Similarly, the statistical analysis conducted on geographies consisting of 276,889,106 people shows a moderate positive correlation between the proportion of Egyptians and labor force participation rate among population between the ages 20 and 24 in the United States with a correlation coefficient (R) of 0.467 and weighted average of 73.7%, a difference of 3.1%.
In Labor Force | Age 20-24 Correlation Summary
| Measurement | Iraqi | Egyptian |
| Minimum | 46.2% | 58.3% |
| Maximum | 100.0% | 100.0% |
| Range | 53.8% | 41.7% |
| Mean | 75.9% | 76.2% |
| Median | 76.1% | 74.6% |
| Interquartile 25% (IQ1) | 72.8% | 70.5% |
| Interquartile 75% (IQ3) | 80.1% | 81.5% |
| Interquartile Range (IQR) | 7.3% | 11.0% |
| Standard Deviation (Sample) | 9.1% | 10.4% |
| Standard Deviation (Population) | 9.1% | 10.3% |
Similar Demographics by In Labor Force | Age 20-24
Demographics Similar to Iraqis by In Labor Force | Age 20-24
In terms of in labor force | age 20-24, the demographic groups most similar to Iraqis are Greek (76.0%, a difference of 0.030%), Immigrants from Uganda (76.0%, a difference of 0.060%), Macedonian (76.0%, a difference of 0.070%), Immigrants from Nepal (76.0%, a difference of 0.070%), and Cherokee (75.9%, a difference of 0.080%).
| Demographics | Rating | Rank | In Labor Force | Age 20-24 |
| Immigrants | Poland | 97.7 /100 | #101 | Exceptional 76.1% |
| Latvians | 97.6 /100 | #102 | Exceptional 76.1% |
| Immigrants | North Macedonia | 97.5 /100 | #103 | Exceptional 76.1% |
| Macedonians | 97.2 /100 | #104 | Exceptional 76.0% |
| Immigrants | Nepal | 97.2 /100 | #105 | Exceptional 76.0% |
| Immigrants | Uganda | 97.1 /100 | #106 | Exceptional 76.0% |
| Greeks | 96.9 /100 | #107 | Exceptional 76.0% |
| Iraqis | 96.6 /100 | #108 | Exceptional 76.0% |
| Cherokee | 95.8 /100 | #109 | Exceptional 75.9% |
| Immigrants | Morocco | 95.8 /100 | #110 | Exceptional 75.9% |
| Ukrainians | 95.7 /100 | #111 | Exceptional 75.9% |
| Immigrants | Canada | 95.6 /100 | #112 | Exceptional 75.9% |
| Immigrants | Netherlands | 95.3 /100 | #113 | Exceptional 75.9% |
| Immigrants | Zimbabwe | 95.1 /100 | #114 | Exceptional 75.9% |
| Alaska Natives | 95.1 /100 | #115 | Exceptional 75.9% |
Demographics Similar to Egyptians by In Labor Force | Age 20-24
In terms of in labor force | age 20-24, the demographic groups most similar to Egyptians are Dutch West Indian (73.7%, a difference of 0.0%), Immigrants from Turkey (73.7%, a difference of 0.030%), Paraguayan (73.7%, a difference of 0.040%), Houma (73.7%, a difference of 0.040%), and Asian (73.7%, a difference of 0.050%).
| Demographics | Rating | Rank | In Labor Force | Age 20-24 |
| Immigrants | Egypt | 1.2 /100 | #251 | Tragic 73.8% |
| Immigrants | Kazakhstan | 1.1 /100 | #252 | Tragic 73.8% |
| Arapaho | 1.0 /100 | #253 | Tragic 73.8% |
| Ute | 1.0 /100 | #254 | Tragic 73.8% |
| Immigrants | Pakistan | 0.9 /100 | #255 | Tragic 73.8% |
| Spanish American Indians | 0.8 /100 | #256 | Tragic 73.7% |
| Paraguayans | 0.8 /100 | #257 | Tragic 73.7% |
| Egyptians | 0.7 /100 | #258 | Tragic 73.7% |
| Dutch West Indians | 0.7 /100 | #259 | Tragic 73.7% |
| Immigrants | Turkey | 0.7 /100 | #260 | Tragic 73.7% |
| Houma | 0.6 /100 | #261 | Tragic 73.7% |
| Asians | 0.6 /100 | #262 | Tragic 73.7% |
| Immigrants | Asia | 0.5 /100 | #263 | Tragic 73.6% |
| Immigrants | Haiti | 0.5 /100 | #264 | Tragic 73.6% |
| Burmese | 0.5 /100 | #265 | Tragic 73.6% |