Iraqi vs Alaska Native In Labor Force | Age 35-44
COMPARE
Iraqi
Alaska Native
In Labor Force | Age 35-44
In Labor Force | Age 35-44 Comparison
Iraqis
Alaska Natives
83.8%
IN LABOR FORCE | AGE 35-44
1.3/ 100
METRIC RATING
241st/ 347
METRIC RANK
81.6%
IN LABOR FORCE | AGE 35-44
0.0/ 100
METRIC RATING
312th/ 347
METRIC RANK
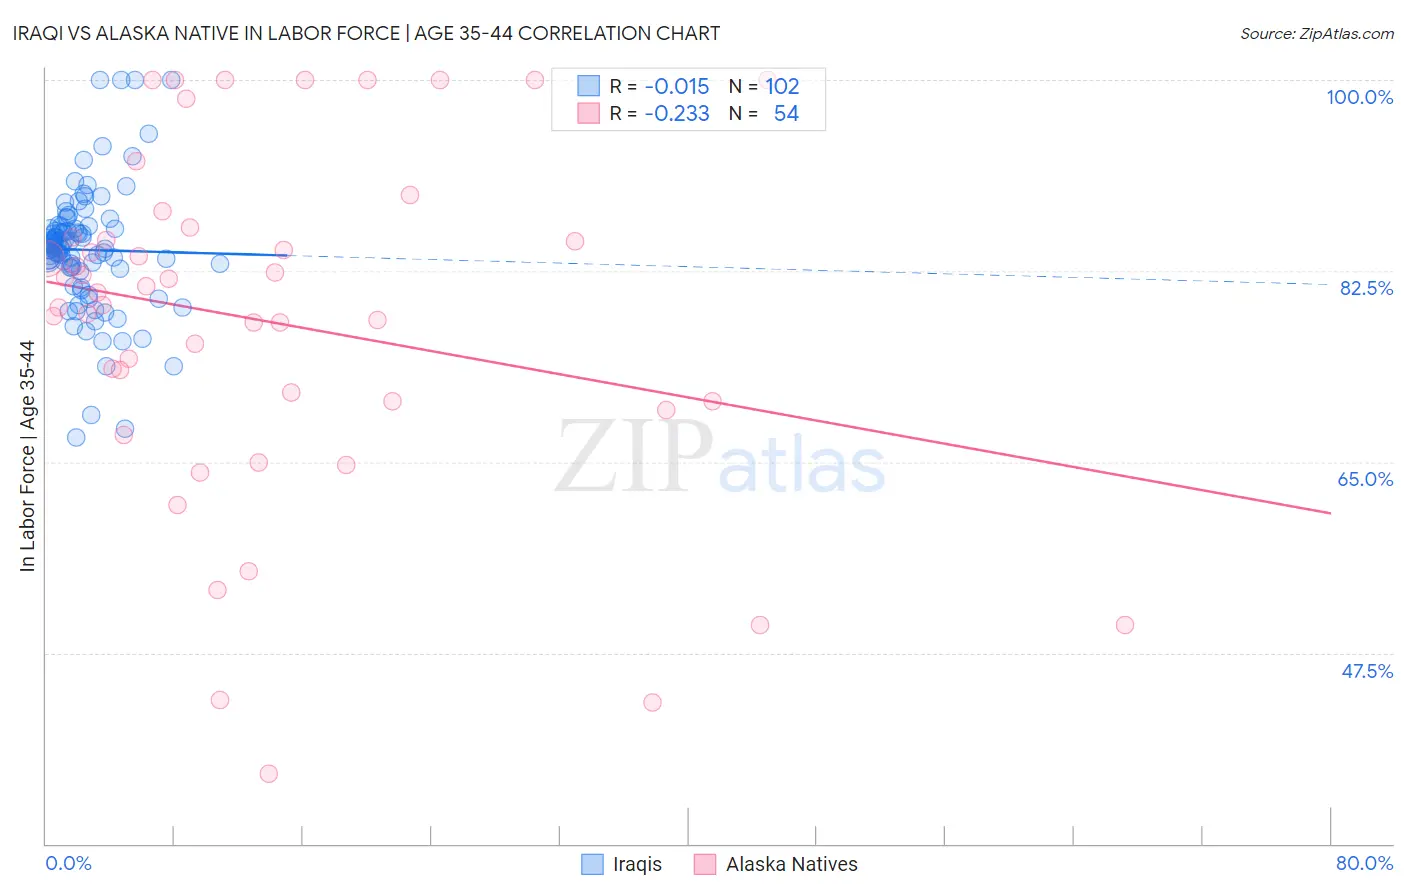
Iraqi vs Alaska Native In Labor Force | Age 35-44 Correlation Chart
The statistical analysis conducted on geographies consisting of 170,582,989 people shows no correlation between the proportion of Iraqis and labor force participation rate among population between the ages 35 and 44 in the United States with a correlation coefficient (R) of -0.015 and weighted average of 83.8%. Similarly, the statistical analysis conducted on geographies consisting of 76,764,235 people shows a weak negative correlation between the proportion of Alaska Natives and labor force participation rate among population between the ages 35 and 44 in the United States with a correlation coefficient (R) of -0.233 and weighted average of 81.6%, a difference of 2.7%.
In Labor Force | Age 35-44 Correlation Summary
| Measurement | Iraqi | Alaska Native |
| Minimum | 67.2% | 36.4% |
| Maximum | 100.0% | 100.0% |
| Range | 32.8% | 63.6% |
| Mean | 84.4% | 77.8% |
| Median | 84.6% | 79.9% |
| Interquartile 25% (IQ1) | 82.7% | 70.5% |
| Interquartile 75% (IQ3) | 86.4% | 85.5% |
| Interquartile Range (IQR) | 3.7% | 15.0% |
| Standard Deviation (Sample) | 5.8% | 15.9% |
| Standard Deviation (Population) | 5.7% | 15.7% |
Similar Demographics by In Labor Force | Age 35-44
Demographics Similar to Iraqis by In Labor Force | Age 35-44
In terms of in labor force | age 35-44, the demographic groups most similar to Iraqis are Arab (83.8%, a difference of 0.0%), Celtic (83.8%, a difference of 0.010%), Immigrants from Cambodia (83.8%, a difference of 0.020%), Immigrants from Western Asia (83.8%, a difference of 0.030%), and Guyanese (83.8%, a difference of 0.030%).
| Demographics | Rating | Rank | In Labor Force | Age 35-44 |
| Immigrants | Oceania | 2.6 /100 | #234 | Tragic 83.9% |
| Immigrants | Syria | 2.5 /100 | #235 | Tragic 83.9% |
| West Indians | 2.4 /100 | #236 | Tragic 83.9% |
| English | 1.8 /100 | #237 | Tragic 83.8% |
| Immigrants | Laos | 1.7 /100 | #238 | Tragic 83.8% |
| Celtics | 1.4 /100 | #239 | Tragic 83.8% |
| Arabs | 1.3 /100 | #240 | Tragic 83.8% |
| Iraqis | 1.3 /100 | #241 | Tragic 83.8% |
| Immigrants | Cambodia | 1.1 /100 | #242 | Tragic 83.8% |
| Immigrants | Western Asia | 1.1 /100 | #243 | Tragic 83.8% |
| Guyanese | 1.1 /100 | #244 | Tragic 83.8% |
| Malaysians | 1.1 /100 | #245 | Tragic 83.8% |
| Immigrants | Immigrants | 1.0 /100 | #246 | Tragic 83.7% |
| Immigrants | Armenia | 0.9 /100 | #247 | Tragic 83.7% |
| Indonesians | 0.8 /100 | #248 | Tragic 83.7% |
Demographics Similar to Alaska Natives by In Labor Force | Age 35-44
In terms of in labor force | age 35-44, the demographic groups most similar to Alaska Natives are Mexican (81.6%, a difference of 0.0%), Cajun (81.5%, a difference of 0.12%), Colville (81.7%, a difference of 0.14%), Immigrants from Mexico (81.5%, a difference of 0.14%), and Comanche (81.5%, a difference of 0.16%).
| Demographics | Rating | Rank | In Labor Force | Age 35-44 |
| Shoshone | 0.0 /100 | #305 | Tragic 82.2% |
| Blacks/African Americans | 0.0 /100 | #306 | Tragic 82.2% |
| Hispanics or Latinos | 0.0 /100 | #307 | Tragic 82.1% |
| Immigrants | Central America | 0.0 /100 | #308 | Tragic 82.0% |
| Cree | 0.0 /100 | #309 | Tragic 82.0% |
| Blackfeet | 0.0 /100 | #310 | Tragic 81.9% |
| Colville | 0.0 /100 | #311 | Tragic 81.7% |
| Alaska Natives | 0.0 /100 | #312 | Tragic 81.6% |
| Mexicans | 0.0 /100 | #313 | Tragic 81.6% |
| Cajuns | 0.0 /100 | #314 | Tragic 81.5% |
| Immigrants | Mexico | 0.0 /100 | #315 | Tragic 81.5% |
| Comanche | 0.0 /100 | #316 | Tragic 81.5% |
| Cherokee | 0.0 /100 | #317 | Tragic 81.4% |
| Alaskan Athabascans | 0.0 /100 | #318 | Tragic 81.3% |
| Inupiat | 0.0 /100 | #319 | Tragic 80.9% |