Iranian vs Costa Rican In Labor Force | Age > 16

COMPARE

Iranian
Race
Ancestry
AfghanAfricanAlaska NativeAlaskan AthabascanAlbanianAleutAlsatianAmericanApacheArabArapahoArgentineanArmenianAssyrian/Chaldean/SyriacAustralianAustrianBahamianBangladeshiBarbadianBasqueBelgianBelizeanBermudanBhutaneseBlackfeetBolivianBrazilianBritishBritish West IndianBulgarianBurmeseCajunCambodianCanadianCape VerdeanCarpatho RusynCelticCentral AmericanCentral American IndianCherokeeCheyenneChickasawChileanChineseChippewaChoctawColombianColvilleComancheCreeCreekCroatianCrowCubanCypriotCzechCzechoslovakianDanishDelawareDominicanDutchDutch West IndianEastern EuropeanEcuadorianEgyptianEnglishEstonianEthiopianEuropeanFijianFilipinoFinnishFrenchFrench American IndianFrench CanadianGermanGerman RussianGhanaianGreekGuamanian/ChamorroGuatemalanGuyaneseHaitianHmongHonduranHopiHoumaHungarianIcelanderIndian (Asian)IndonesianInupiatIranianIraqiIrishIroquoisIsraeliItalianJamaicanJapaneseJordanianKenyanKiowaKoreanLaotianLatvianLebaneseLiberianLithuanianLumbeeLuxembourgerMacedonianMalaysianMalteseMarshalleseMenomineeMexicanMexican American IndianMongolianMoroccanNative HawaiianNavajoNepaleseNew ZealanderNicaraguanNigerianNorthern EuropeanNorwegianOkinawanOsageOttawaPaiutePakistaniPalestinianPanamanianParaguayanPennsylvania GermanPeruvianPimaPolishPortuguesePotawatomiPuebloPuerto RicanPuget Sound SalishRomanianRussianSalvadoranSamoanScandinavianScotch-IrishScottishSeminoleSenegaleseSerbianShoshoneSierra LeoneanSiouxSlavicSlovakSloveneSomaliSouth AfricanSouth AmericanSouth American IndianSoviet UnionSpaniardSpanishSpanish AmericanSpanish American IndianSri LankanSubsaharan AfricanSudaneseSwedishSwissSyrianTaiwaneseThaiTlingit-HaidaTohono O'OdhamTonganTrinidadian and TobagonianTsimshianTurkishU.S. Virgin IslanderUgandanUkrainianUruguayanUteVenezuelanVietnameseWelshWest IndianYakamaYaquiYugoslavianYumanYup'ikZimbabwean
Immigration
NonimmigrantsImmigrantsAfghanistanAfricaAlbaniaArgentinaArmeniaAsiaAustraliaAustriaBahamasBangladeshBarbadosBelarusBelgiumBelizeBoliviaBosnia and HerzegovinaBrazilBulgariaBurma/MyanmarCabo VerdeCambodiaCameroonCanadaCaribbeanCentral AmericaChileChinaColombiaCongoCosta RicaCroatiaCubaCzechoslovakiaDenmarkDominicaDominican RepublicEastern AfricaEastern AsiaEastern EuropeEcuadorEgyptEl SalvadorEnglandEritreaEthiopiaEuropeFijiFranceGermanyGhanaGreeceGrenadaGuatemalaGuyanaHaitiHondurasHong KongHungaryIndiaIndonesiaIranIraqIrelandIsraelItalyJamaicaJapanJordanKazakhstanKenyaKoreaKuwaitLaosLatin AmericaLatviaLebanonLiberiaLithuaniaMalaysiaMexicoMicronesiaMiddle AfricaMoldovaMoroccoNepalNetherlandsNicaraguaNigeriaNorth AmericaNorth MacedoniaNorthern AfricaNorthern EuropeNorwayOceaniaPakistanPanamaPeruPhilippinesPolandPortugalRomaniaRussiaSaudi ArabiaScotlandSenegalSerbiaSierra LeoneSingaporeSomaliaSouth AfricaSouth AmericaSouth Central AsiaSouth Eastern AsiaSouthern EuropeSpainSri LankaSt. Vincent and the GrenadinesSudanSwedenSwitzerlandSyriaTaiwanThailandTrinidad and TobagoTurkeyUgandaUkraineUruguayUzbekistanVenezuelaVietnamWest IndiesWestern AfricaWestern AsiaWestern EuropeYemenZaireZimbabweAzores
Costa Rican
Race
Ancestry
AfghanAfricanAlaska NativeAlaskan AthabascanAlbanianAleutAlsatianAmericanApacheArabArapahoArgentineanArmenianAssyrian/Chaldean/SyriacAustralianAustrianBahamianBangladeshiBarbadianBasqueBelgianBelizeanBermudanBhutaneseBlackfeetBolivianBrazilianBritishBritish West IndianBulgarianBurmeseCajunCambodianCanadianCape VerdeanCarpatho RusynCelticCentral AmericanCentral American IndianCherokeeCheyenneChickasawChileanChineseChippewaChoctawColombianColvilleComancheCosta RicanCreeCreekCroatianCrowCubanCypriotCzechCzechoslovakianDanishDelawareDominicanDutchDutch West IndianEastern EuropeanEcuadorianEgyptianEnglishEstonianEthiopianEuropeanFijianFilipinoFinnishFrenchFrench American IndianFrench CanadianGermanGerman RussianGhanaianGreekGuamanian/ChamorroGuatemalanGuyaneseHaitianHmongHonduranHopiHoumaHungarianIcelanderIndian (Asian)IndonesianInupiatIraqiIrishIroquoisIsraeliItalianJamaicanJapaneseJordanianKenyanKiowaKoreanLaotianLatvianLebaneseLiberianLithuanianLumbeeLuxembourgerMacedonianMalaysianMalteseMarshalleseMenomineeMexicanMexican American IndianMongolianMoroccanNative HawaiianNavajoNepaleseNew ZealanderNicaraguanNigerianNorthern EuropeanNorwegianOkinawanOsageOttawaPaiutePakistaniPalestinianPanamanianParaguayanPennsylvania GermanPeruvianPimaPolishPortuguesePotawatomiPuebloPuerto RicanPuget Sound SalishRomanianRussianSalvadoranSamoanScandinavianScotch-IrishScottishSeminoleSenegaleseSerbianShoshoneSierra LeoneanSiouxSlavicSlovakSloveneSomaliSouth AfricanSouth AmericanSouth American IndianSoviet UnionSpaniardSpanishSpanish AmericanSpanish American IndianSri LankanSubsaharan AfricanSudaneseSwedishSwissSyrianTaiwaneseThaiTlingit-HaidaTohono O'OdhamTonganTrinidadian and TobagonianTsimshianTurkishU.S. Virgin IslanderUgandanUkrainianUruguayanUteVenezuelanVietnameseWelshWest IndianYakamaYaquiYugoslavianYumanYup'ikZimbabwean
Immigration
NonimmigrantsImmigrantsAfghanistanAfricaAlbaniaArgentinaArmeniaAsiaAustraliaAustriaBahamasBangladeshBarbadosBelarusBelgiumBelizeBoliviaBosnia and HerzegovinaBrazilBulgariaBurma/MyanmarCabo VerdeCambodiaCameroonCanadaCaribbeanCentral AmericaChileChinaColombiaCongoCosta RicaCroatiaCubaCzechoslovakiaDenmarkDominicaDominican RepublicEastern AfricaEastern AsiaEastern EuropeEcuadorEgyptEl SalvadorEnglandEritreaEthiopiaEuropeFijiFranceGermanyGhanaGreeceGrenadaGuatemalaGuyanaHaitiHondurasHong KongHungaryIndiaIndonesiaIranIraqIrelandIsraelItalyJamaicaJapanJordanKazakhstanKenyaKoreaKuwaitLaosLatin AmericaLatviaLebanonLiberiaLithuaniaMalaysiaMexicoMicronesiaMiddle AfricaMoldovaMoroccoNepalNetherlandsNicaraguaNigeriaNorth AmericaNorth MacedoniaNorthern AfricaNorthern EuropeNorwayOceaniaPakistanPanamaPeruPhilippinesPolandPortugalRomaniaRussiaSaudi ArabiaScotlandSenegalSerbiaSierra LeoneSingaporeSomaliaSouth AfricaSouth AmericaSouth Central AsiaSouth Eastern AsiaSouthern EuropeSpainSri LankaSt. Vincent and the GrenadinesSudanSwedenSwitzerlandSyriaTaiwanThailandTrinidad and TobagoTurkeyUgandaUkraineUruguayUzbekistanVenezuelaVietnamWest IndiesWestern AfricaWestern AsiaWestern EuropeYemenZaireZimbabweAzores
In Labor Force | Age > 16
Income
Poverty
Unemployment
Labor Participation
Family Structure
Vehicle Availability
Education Level
Disability

In Labor Force | Age > 16 Comparison

Iranians

Costa Ricans

Exceptional
Exceptional
66.0%
IN LABOR FORCE | AGE > 16
99.2/ 100
METRIC RATING
91st/ 347
METRIC RANK
65.6%
IN LABOR FORCE | AGE > 16
93.2/ 100
METRIC RATING
134th/ 347
METRIC RANK

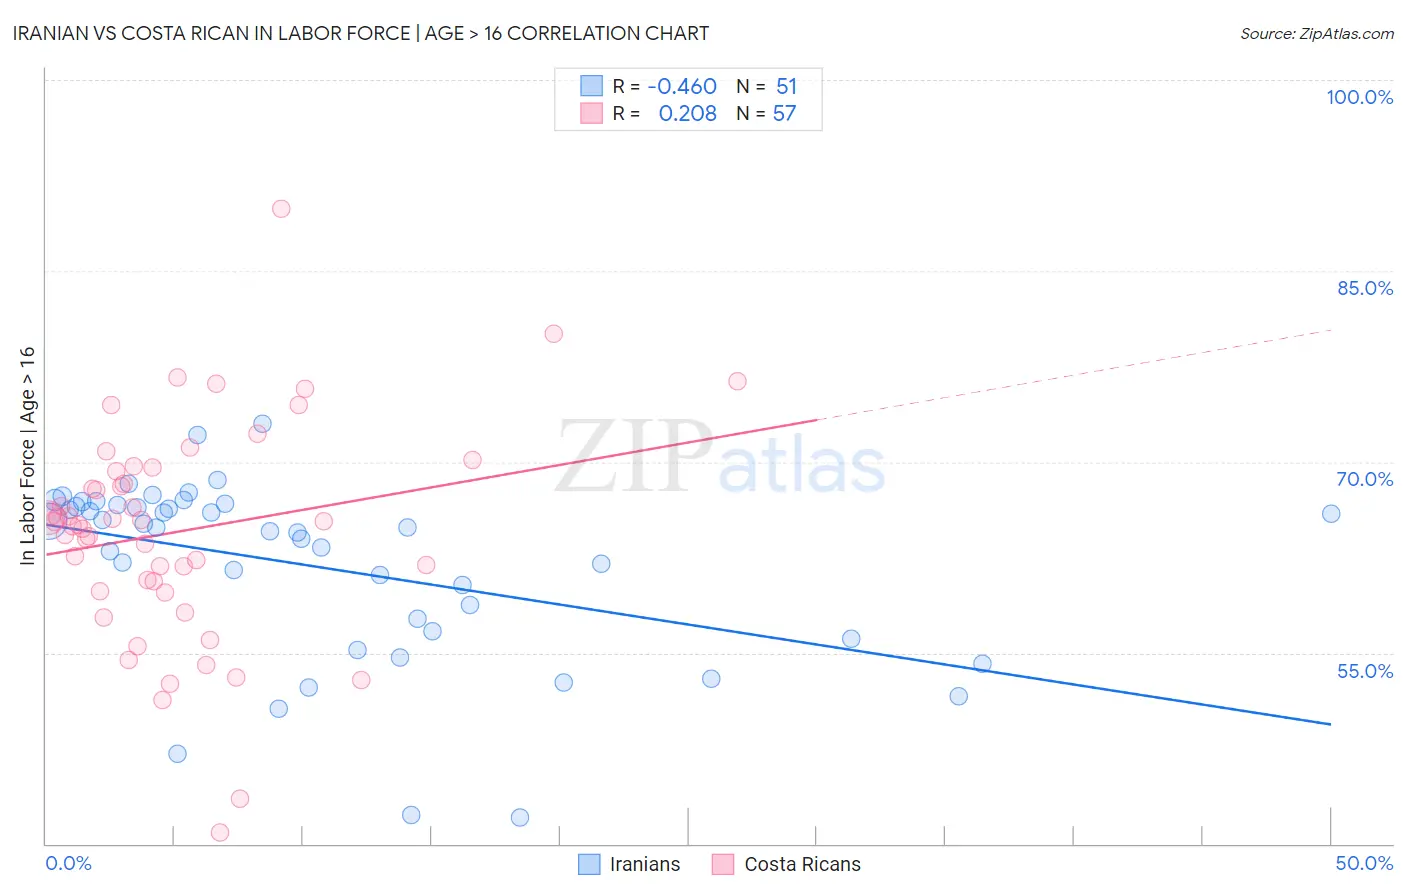
Iranian vs Costa Rican In Labor Force | Age > 16 Correlation Chart

The statistical analysis conducted on geographies consisting of 316,907,854 people shows a moderate negative correlation between the proportion of Iranians and labor force participation rate among population ages 16 and over in the United States with a correlation coefficient (R) of -0.460 and weighted average of 66.0%. Similarly, the statistical analysis conducted on geographies consisting of 253,602,231 people shows a weak positive correlation between the proportion of Costa Ricans and labor force participation rate among population ages 16 and over in the United States with a correlation coefficient (R) of 0.208 and weighted average of 65.6%, a difference of 0.61%.
Iranian vs Costa Rican In Labor Force | Age > 16

In Labor Force | Age > 16 Correlation Summary

MeasurementIranianCosta Rican
Minimum42.1%40.9%
Maximum73.0%89.9%
Range30.9%49.0%
Mean61.8%64.5%
Median64.8%65.3%
Interquartile 25% (IQ1)56.7%60.2%
Interquartile 75% (IQ3)66.7%69.4%
Interquartile Range (IQR)10.0%9.2%
Standard Deviation (Sample)7.1%8.5%
Standard Deviation (Population)7.0%8.5%

Similar Demographics by In Labor Force | Age > 16

Demographics Similar to Iranians by In Labor Force | Age > 16

In terms of in labor force | age > 16, the demographic groups most similar to Iranians are Immigrants from Laos (66.0%, a difference of 0.010%), Chilean (66.0%, a difference of 0.010%), Aleut (66.0%, a difference of 0.020%), Immigrants from South America (66.0%, a difference of 0.030%), and Immigrants from Cambodia (66.0%, a difference of 0.040%).
DemographicsRating | RankIn Labor Force | Age > 16
Central Americans
99.4
/100
|
#84
Exceptional
66.1%
Mongolians
99.4
/100
|
#85
Exceptional
66.1%
South Americans
99.4
/100
|
#86
Exceptional
66.0%
South American Indians
99.4
/100
|
#87
Exceptional
66.0%
Bermudans
99.3
/100
|
#88
Exceptional
66.0%
Immigrants | Laos
99.2
/100
|
#89
Exceptional
66.0%
Chileans
99.2
/100
|
#90
Exceptional
66.0%
Iranians
99.2
/100
|
#91
Exceptional
66.0%
Aleuts
99.1
/100
|
#92
Exceptional
66.0%
Immigrants | South America
99.1
/100
|
#93
Exceptional
66.0%
Immigrants | Cambodia
99.1
/100
|
#94
Exceptional
66.0%
Immigrants | Uruguay
99.1
/100
|
#95
Exceptional
66.0%
Bangladeshis
98.9
/100
|
#96
Exceptional
65.9%
Filipinos
98.9
/100
|
#97
Exceptional
65.9%
Immigrants | Chile
98.7
/100
|
#98
Exceptional
65.9%

Demographics Similar to Costa Ricans by In Labor Force | Age > 16

In terms of in labor force | age > 16, the demographic groups most similar to Costa Ricans are Immigrants from Lithuania (65.6%, a difference of 0.010%), Guatemalan (65.6%, a difference of 0.030%), Immigrants from Argentina (65.6%, a difference of 0.030%), Immigrants from North Macedonia (65.6%, a difference of 0.040%), and Guamanian/Chamorro (65.6%, a difference of 0.040%).
DemographicsRating | RankIn Labor Force | Age > 16
Immigrants | Eastern Asia
94.9
/100
|
#127
Exceptional
65.7%
Ecuadorians
94.7
/100
|
#128
Exceptional
65.6%
Immigrants | Philippines
94.5
/100
|
#129
Exceptional
65.6%
Immigrants | Guatemala
94.4
/100
|
#130
Exceptional
65.6%
Icelanders
94.3
/100
|
#131
Exceptional
65.6%
Immigrants | North Macedonia
94.1
/100
|
#132
Exceptional
65.6%
Immigrants | Lithuania
93.5
/100
|
#133
Exceptional
65.6%
Costa Ricans
93.2
/100
|
#134
Exceptional
65.6%
Guatemalans
92.5
/100
|
#135
Exceptional
65.6%
Immigrants | Argentina
92.4
/100
|
#136
Exceptional
65.6%
Guamanians/Chamorros
92.4
/100
|
#137
Exceptional
65.6%
Immigrants | West Indies
92.0
/100
|
#138
Exceptional
65.6%
Immigrants | Taiwan
90.8
/100
|
#139
Exceptional
65.5%
Immigrants | Costa Rica
90.8
/100
|
#140
Exceptional
65.5%
Samoans
90.5
/100
|
#141
Exceptional
65.5%