Indian (Asian) vs Palestinian In Labor Force | Age 25-29
COMPARE
Indian (Asian)
Palestinian
In Labor Force | Age 25-29
In Labor Force | Age 25-29 Comparison
Indians (Asian)
Palestinians
84.7%
IN LABOR FORCE | AGE 25-29
61.6/ 100
METRIC RATING
155th/ 347
METRIC RANK
84.7%
IN LABOR FORCE | AGE 25-29
50.0/ 100
METRIC RATING
174th/ 347
METRIC RANK
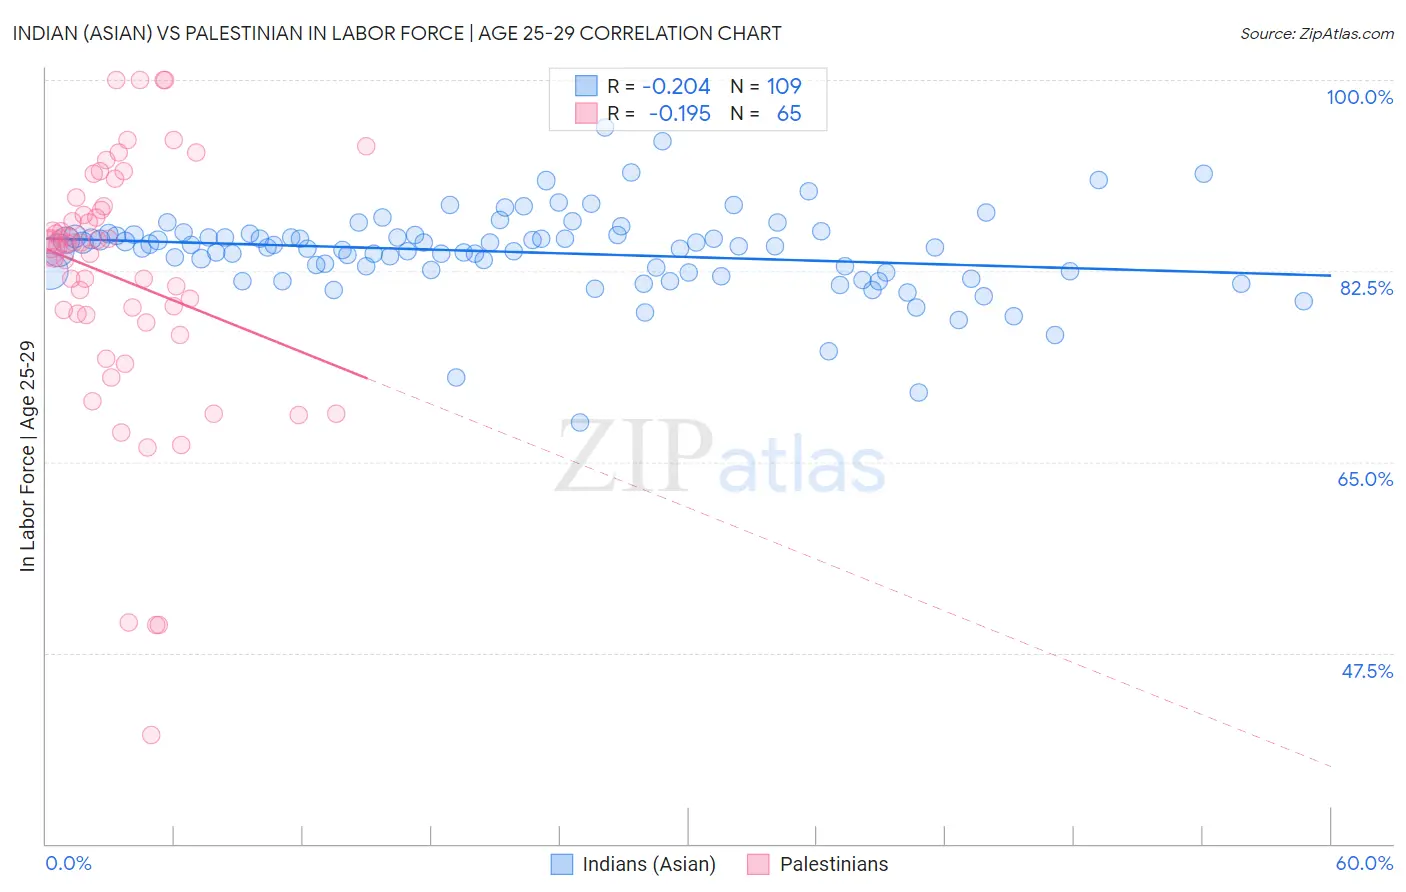
Indian (Asian) vs Palestinian In Labor Force | Age 25-29 Correlation Chart
The statistical analysis conducted on geographies consisting of 494,999,780 people shows a weak negative correlation between the proportion of Indians (Asian) and labor force participation rate among population between the ages 25 and 29 in the United States with a correlation coefficient (R) of -0.204 and weighted average of 84.7%. Similarly, the statistical analysis conducted on geographies consisting of 216,447,152 people shows a poor negative correlation between the proportion of Palestinians and labor force participation rate among population between the ages 25 and 29 in the United States with a correlation coefficient (R) of -0.195 and weighted average of 84.7%, a difference of 0.090%.
In Labor Force | Age 25-29 Correlation Summary
| Measurement | Indian (Asian) | Palestinian |
| Minimum | 68.6% | 40.0% |
| Maximum | 95.6% | 100.0% |
| Range | 27.0% | 60.0% |
| Mean | 84.2% | 81.8% |
| Median | 84.7% | 84.8% |
| Interquartile 25% (IQ1) | 82.4% | 78.1% |
| Interquartile 75% (IQ3) | 85.8% | 88.2% |
| Interquartile Range (IQR) | 3.4% | 10.1% |
| Standard Deviation (Sample) | 3.9% | 12.1% |
| Standard Deviation (Population) | 3.9% | 12.0% |
Demographics Similar to Indians (Asian) and Palestinians by In Labor Force | Age 25-29
In terms of in labor force | age 25-29, the demographic groups most similar to Indians (Asian) are Immigrants from Sri Lanka (84.7%, a difference of 0.0%), French (84.7%, a difference of 0.0%), British (84.7%, a difference of 0.010%), Immigrants from Ghana (84.7%, a difference of 0.010%), and Immigrants from Western Africa (84.7%, a difference of 0.010%). Similarly, the demographic groups most similar to Palestinians are Immigrants from Vietnam (84.7%, a difference of 0.0%), Immigrants from Western Europe (84.7%, a difference of 0.0%), Assyrian/Chaldean/Syriac (84.7%, a difference of 0.0%), Celtic (84.7%, a difference of 0.020%), and Tongan (84.7%, a difference of 0.020%).
| Demographics | Rating | Rank | In Labor Force | Age 25-29 |
| Immigrants | Sri Lanka | 61.7 /100 | #154 | Good 84.7% |
| Indians (Asian) | 61.6 /100 | #155 | Good 84.7% |
| French | 61.0 /100 | #156 | Good 84.7% |
| British | 60.4 /100 | #157 | Good 84.7% |
| Immigrants | Ghana | 60.2 /100 | #158 | Good 84.7% |
| Immigrants | Western Africa | 60.1 /100 | #159 | Good 84.7% |
| Immigrants | Peru | 58.6 /100 | #160 | Average 84.7% |
| Canadians | 58.5 /100 | #161 | Average 84.7% |
| Immigrants | Colombia | 58.3 /100 | #162 | Average 84.7% |
| Argentineans | 57.9 /100 | #163 | Average 84.7% |
| Ghanaians | 57.6 /100 | #164 | Average 84.7% |
| Immigrants | Burma/Myanmar | 57.4 /100 | #165 | Average 84.7% |
| Immigrants | Spain | 56.9 /100 | #166 | Average 84.7% |
| Indonesians | 56.5 /100 | #167 | Average 84.7% |
| South Americans | 54.9 /100 | #168 | Average 84.7% |
| Celtics | 52.5 /100 | #169 | Average 84.7% |
| Tongans | 52.4 /100 | #170 | Average 84.7% |
| Immigrants | Vietnam | 50.5 /100 | #171 | Average 84.7% |
| Immigrants | Western Europe | 50.4 /100 | #172 | Average 84.7% |
| Assyrians/Chaldeans/Syriacs | 50.2 /100 | #173 | Average 84.7% |
| Palestinians | 50.0 /100 | #174 | Average 84.7% |