Immigrants vs Native/Alaskan In Labor Force | Age 16-19
COMPARE
Immigrants
Native/Alaskan
In Labor Force | Age 16-19
In Labor Force | Age 16-19 Comparison
Immigrants
Natives/Alaskans
34.6%
IN LABOR FORCE | AGE 16-19
1.2/ 100
METRIC RATING
259th/ 347
METRIC RANK
36.6%
IN LABOR FORCE | AGE 16-19
49.0/ 100
METRIC RATING
175th/ 347
METRIC RANK
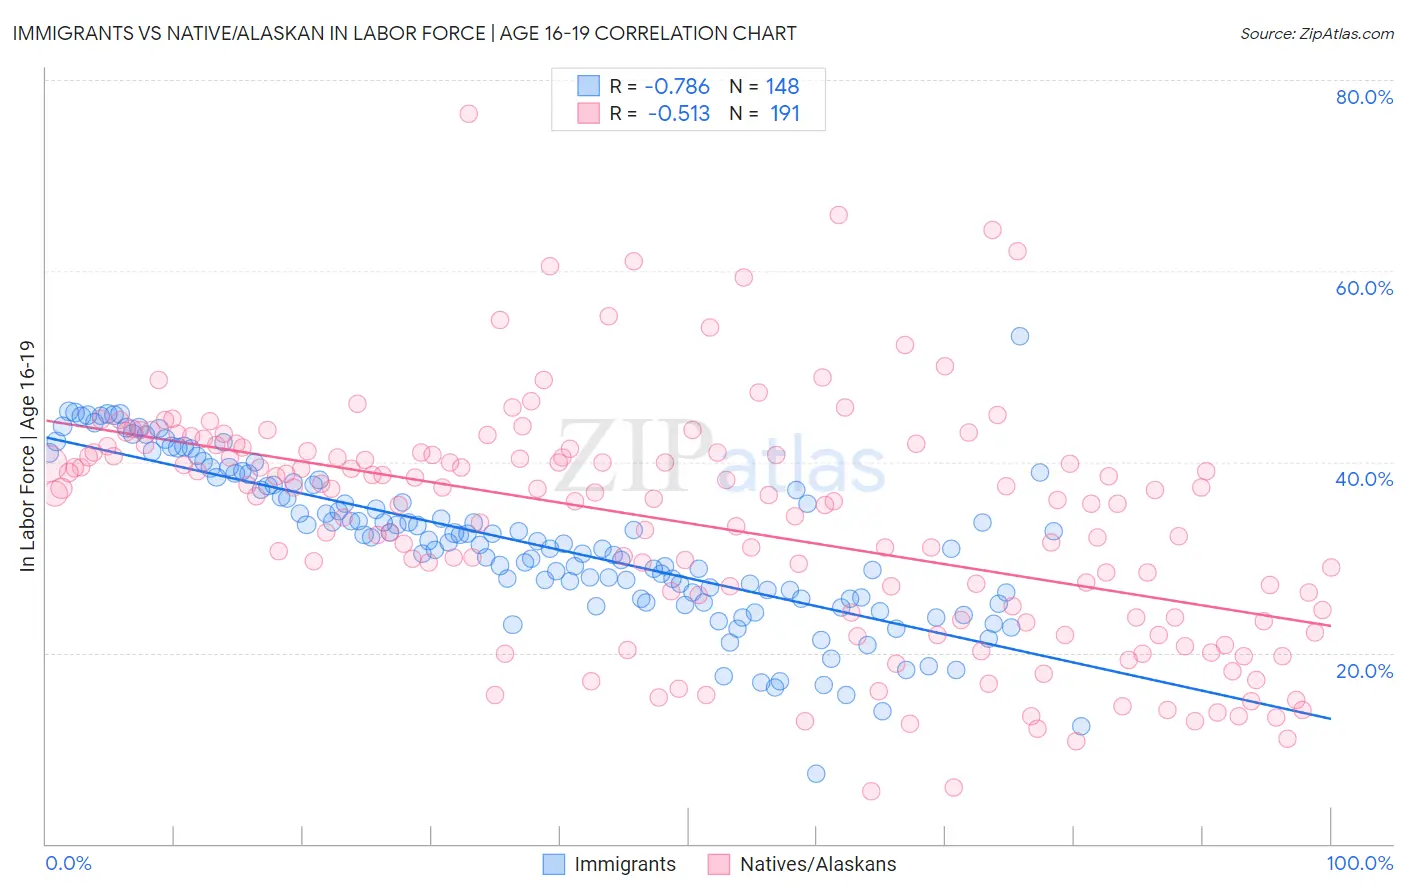
Immigrants vs Native/Alaskan In Labor Force | Age 16-19 Correlation Chart
The statistical analysis conducted on geographies consisting of 573,117,494 people shows a strong negative correlation between the proportion of Immigrants and labor force participation rate among population between the ages 16 and 19 in the United States with a correlation coefficient (R) of -0.786 and weighted average of 34.6%. Similarly, the statistical analysis conducted on geographies consisting of 511,038,872 people shows a substantial negative correlation between the proportion of Natives/Alaskans and labor force participation rate among population between the ages 16 and 19 in the United States with a correlation coefficient (R) of -0.513 and weighted average of 36.6%, a difference of 5.8%.
In Labor Force | Age 16-19 Correlation Summary
| Measurement | Immigrants | Native/Alaskan |
| Minimum | 7.3% | 5.5% |
| Maximum | 53.1% | 76.4% |
| Range | 45.8% | 70.9% |
| Mean | 31.5% | 33.6% |
| Median | 31.6% | 36.4% |
| Interquartile 25% (IQ1) | 25.8% | 23.7% |
| Interquartile 75% (IQ3) | 37.7% | 41.0% |
| Interquartile Range (IQR) | 12.0% | 17.3% |
| Standard Deviation (Sample) | 8.3% | 12.4% |
| Standard Deviation (Population) | 8.2% | 12.3% |
Similar Demographics by In Labor Force | Age 16-19
Demographics Similar to Immigrants by In Labor Force | Age 16-19
In terms of in labor force | age 16-19, the demographic groups most similar to Immigrants are Immigrants from Egypt (34.6%, a difference of 0.020%), Thai (34.6%, a difference of 0.020%), Immigrants from South Central Asia (34.6%, a difference of 0.030%), Egyptian (34.5%, a difference of 0.080%), and Salvadoran (34.5%, a difference of 0.12%).
| Demographics | Rating | Rank | In Labor Force | Age 16-19 |
| Immigrants | Chile | 2.0 /100 | #252 | Tragic 34.8% |
| Immigrants | Japan | 1.5 /100 | #253 | Tragic 34.7% |
| Bahamians | 1.4 /100 | #254 | Tragic 34.6% |
| Peruvians | 1.4 /100 | #255 | Tragic 34.6% |
| Immigrants | South Central Asia | 1.3 /100 | #256 | Tragic 34.6% |
| Immigrants | Egypt | 1.2 /100 | #257 | Tragic 34.6% |
| Thais | 1.2 /100 | #258 | Tragic 34.6% |
| Immigrants | Immigrants | 1.2 /100 | #259 | Tragic 34.6% |
| Egyptians | 1.2 /100 | #260 | Tragic 34.5% |
| Salvadorans | 1.1 /100 | #261 | Tragic 34.5% |
| Hispanics or Latinos | 1.1 /100 | #262 | Tragic 34.5% |
| Burmese | 1.1 /100 | #263 | Tragic 34.5% |
| Immigrants | Uruguay | 0.9 /100 | #264 | Tragic 34.4% |
| Immigrants | El Salvador | 0.7 /100 | #265 | Tragic 34.3% |
| Immigrants | Malaysia | 0.7 /100 | #266 | Tragic 34.3% |
Demographics Similar to Natives/Alaskans by In Labor Force | Age 16-19
In terms of in labor force | age 16-19, the demographic groups most similar to Natives/Alaskans are Albanian (36.5%, a difference of 0.010%), Immigrants from Czechoslovakia (36.6%, a difference of 0.050%), Immigrants from Northern Europe (36.5%, a difference of 0.12%), Black/African American (36.5%, a difference of 0.20%), and Immigrants from Southern Europe (36.4%, a difference of 0.29%).
| Demographics | Rating | Rank | In Labor Force | Age 16-19 |
| Palestinians | 63.1 /100 | #168 | Good 36.8% |
| Immigrants | Latvia | 61.6 /100 | #169 | Good 36.8% |
| Immigrants | South Africa | 60.5 /100 | #170 | Good 36.8% |
| Immigrants | Cambodia | 58.4 /100 | #171 | Average 36.7% |
| South Africans | 58.3 /100 | #172 | Average 36.7% |
| Russians | 57.5 /100 | #173 | Average 36.7% |
| Immigrants | Czechoslovakia | 50.0 /100 | #174 | Average 36.6% |
| Natives/Alaskans | 49.0 /100 | #175 | Average 36.6% |
| Albanians | 48.8 /100 | #176 | Average 36.5% |
| Immigrants | Northern Europe | 46.6 /100 | #177 | Average 36.5% |
| Blacks/African Americans | 45.1 /100 | #178 | Average 36.5% |
| Immigrants | Southern Europe | 43.3 /100 | #179 | Average 36.4% |
| Immigrants | Morocco | 41.1 /100 | #180 | Average 36.4% |
| Jordanians | 39.6 /100 | #181 | Fair 36.4% |
| Immigrants | Italy | 39.1 /100 | #182 | Fair 36.4% |