Immigrants from Western Asia vs Shoshone In Labor Force | Age 20-64
COMPARE
Immigrants from Western Asia
Shoshone
In Labor Force | Age 20-64
In Labor Force | Age 20-64 Comparison
Immigrants from Western Asia
Shoshone
79.2%
IN LABOR FORCE | AGE 20-64
11.0/ 100
METRIC RATING
217th/ 347
METRIC RANK
76.8%
IN LABOR FORCE | AGE 20-64
0.0/ 100
METRIC RATING
313th/ 347
METRIC RANK
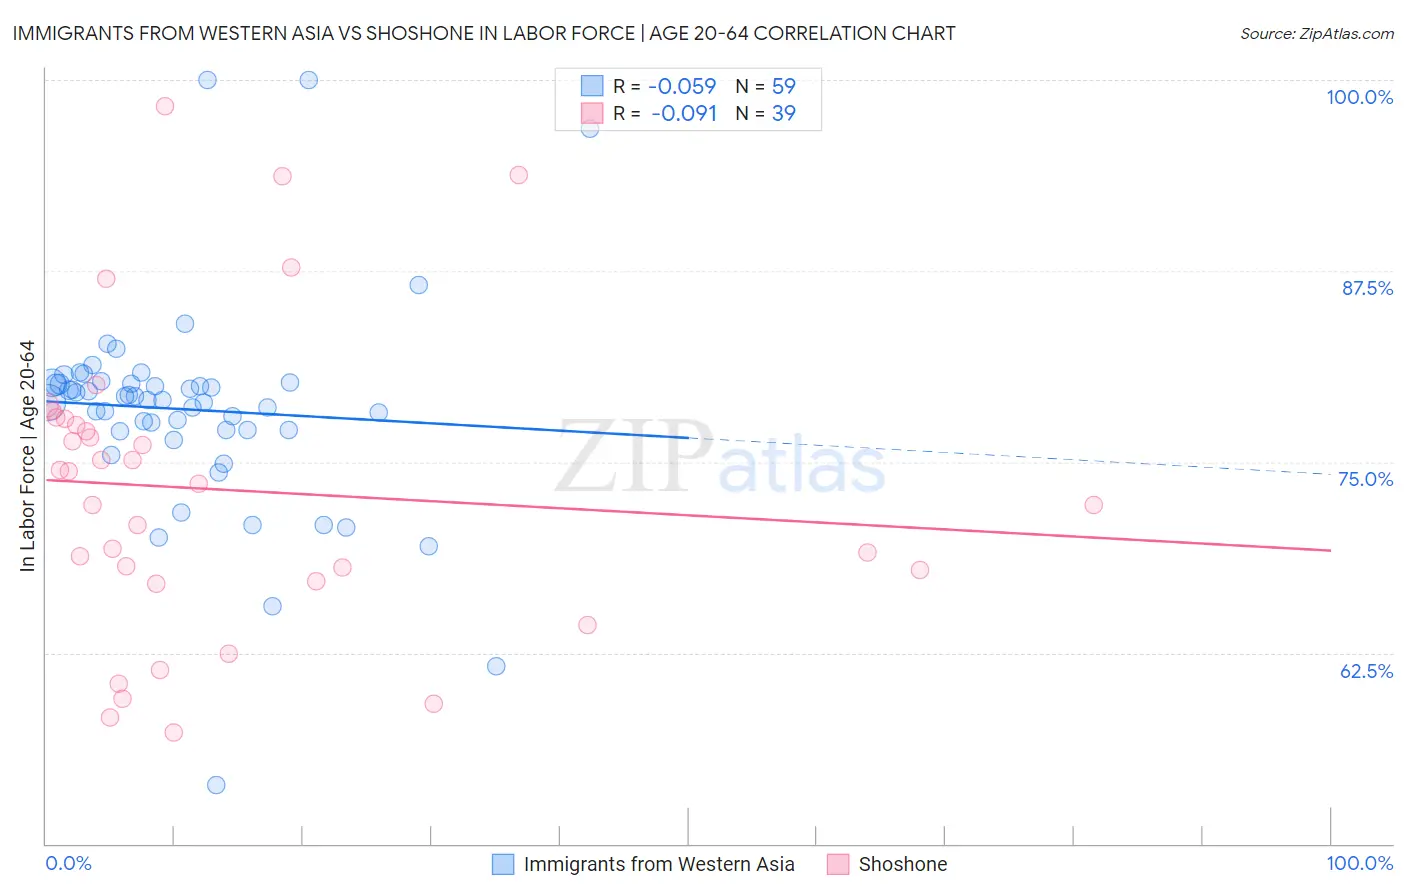
Immigrants from Western Asia vs Shoshone In Labor Force | Age 20-64 Correlation Chart
The statistical analysis conducted on geographies consisting of 404,437,919 people shows a slight negative correlation between the proportion of Immigrants from Western Asia and labor force participation rate among population between the ages 20 and 64 in the United States with a correlation coefficient (R) of -0.059 and weighted average of 79.2%. Similarly, the statistical analysis conducted on geographies consisting of 66,627,303 people shows a slight negative correlation between the proportion of Shoshone and labor force participation rate among population between the ages 20 and 64 in the United States with a correlation coefficient (R) of -0.091 and weighted average of 76.8%, a difference of 3.2%.
In Labor Force | Age 20-64 Correlation Summary
| Measurement | Immigrants from Western Asia | Shoshone |
| Minimum | 53.8% | 57.3% |
| Maximum | 100.0% | 98.3% |
| Range | 46.2% | 41.0% |
| Mean | 78.4% | 73.2% |
| Median | 79.1% | 73.6% |
| Interquartile 25% (IQ1) | 77.1% | 67.2% |
| Interquartile 75% (IQ3) | 80.2% | 77.8% |
| Interquartile Range (IQR) | 3.1% | 10.6% |
| Standard Deviation (Sample) | 7.1% | 9.8% |
| Standard Deviation (Population) | 7.1% | 9.7% |
Similar Demographics by In Labor Force | Age 20-64
Demographics Similar to Immigrants from Western Asia by In Labor Force | Age 20-64
In terms of in labor force | age 20-64, the demographic groups most similar to Immigrants from Western Asia are Arab (79.2%, a difference of 0.010%), Immigrants from Armenia (79.2%, a difference of 0.020%), Immigrants from Norway (79.2%, a difference of 0.020%), Immigrants from Portugal (79.3%, a difference of 0.030%), and Irish (79.3%, a difference of 0.040%).
| Demographics | Rating | Rank | In Labor Force | Age 20-64 |
| Haitians | 16.1 /100 | #210 | Poor 79.3% |
| Europeans | 15.3 /100 | #211 | Poor 79.3% |
| Irish | 13.2 /100 | #212 | Poor 79.3% |
| Immigrants | Portugal | 12.8 /100 | #213 | Poor 79.3% |
| Immigrants | Armenia | 12.2 /100 | #214 | Poor 79.2% |
| Immigrants | Norway | 12.0 /100 | #215 | Poor 79.2% |
| Arabs | 11.4 /100 | #216 | Poor 79.2% |
| Immigrants | Western Asia | 11.0 /100 | #217 | Poor 79.2% |
| Immigrants | England | 9.3 /100 | #218 | Tragic 79.2% |
| French Canadians | 8.4 /100 | #219 | Tragic 79.2% |
| Immigrants | Immigrants | 7.7 /100 | #220 | Tragic 79.2% |
| Hungarians | 7.2 /100 | #221 | Tragic 79.2% |
| Immigrants | Panama | 6.9 /100 | #222 | Tragic 79.1% |
| Canadians | 6.8 /100 | #223 | Tragic 79.1% |
| Immigrants | Uzbekistan | 6.8 /100 | #224 | Tragic 79.1% |
Demographics Similar to Shoshone by In Labor Force | Age 20-64
In terms of in labor force | age 20-64, the demographic groups most similar to Shoshone are Black/African American (76.8%, a difference of 0.020%), Alaskan Athabascan (76.9%, a difference of 0.12%), Ottawa (76.7%, a difference of 0.12%), Blackfeet (77.0%, a difference of 0.29%), and Yaqui (76.5%, a difference of 0.31%).
| Demographics | Rating | Rank | In Labor Force | Age 20-64 |
| Potawatomi | 0.0 /100 | #306 | Tragic 77.2% |
| Central American Indians | 0.0 /100 | #307 | Tragic 77.1% |
| Alaska Natives | 0.0 /100 | #308 | Tragic 77.0% |
| Americans | 0.0 /100 | #309 | Tragic 77.0% |
| Comanche | 0.0 /100 | #310 | Tragic 77.0% |
| Blackfeet | 0.0 /100 | #311 | Tragic 77.0% |
| Alaskan Athabascans | 0.0 /100 | #312 | Tragic 76.9% |
| Shoshone | 0.0 /100 | #313 | Tragic 76.8% |
| Blacks/African Americans | 0.0 /100 | #314 | Tragic 76.8% |
| Ottawa | 0.0 /100 | #315 | Tragic 76.7% |
| Yaqui | 0.0 /100 | #316 | Tragic 76.5% |
| Cherokee | 0.0 /100 | #317 | Tragic 76.2% |
| Chickasaw | 0.0 /100 | #318 | Tragic 76.2% |
| Inupiat | 0.0 /100 | #319 | Tragic 76.1% |
| Yakama | 0.0 /100 | #320 | Tragic 75.8% |