Immigrants from Western Africa vs Immigrants from Iraq In Labor Force | Age 16-19

COMPARE

Immigrants from Western Africa
Race
Ancestry
AfghanAfricanAlaska NativeAlaskan AthabascanAlbanianAleutAlsatianAmericanApacheArabArapahoArgentineanArmenianAssyrian/Chaldean/SyriacAustralianAustrianBahamianBangladeshiBarbadianBasqueBelgianBelizeanBermudanBhutaneseBlackfeetBolivianBrazilianBritishBritish West IndianBulgarianBurmeseCajunCambodianCanadianCape VerdeanCarpatho RusynCelticCentral AmericanCentral American IndianCherokeeCheyenneChickasawChileanChineseChippewaChoctawColombianColvilleComancheCosta RicanCreeCreekCroatianCrowCubanCypriotCzechCzechoslovakianDanishDelawareDominicanDutchDutch West IndianEastern EuropeanEcuadorianEgyptianEnglishEstonianEthiopianEuropeanFijianFilipinoFinnishFrenchFrench American IndianFrench CanadianGermanGerman RussianGhanaianGreekGuamanian/ChamorroGuatemalanGuyaneseHaitianHmongHonduranHopiHoumaHungarianIcelanderIndian (Asian)IndonesianInupiatIranianIraqiIrishIroquoisIsraeliItalianJamaicanJapaneseJordanianKenyanKiowaKoreanLaotianLatvianLebaneseLiberianLithuanianLumbeeLuxembourgerMacedonianMalaysianMalteseMarshalleseMenomineeMexicanMexican American IndianMongolianMoroccanNative HawaiianNavajoNepaleseNew ZealanderNicaraguanNigerianNorthern EuropeanNorwegianOkinawanOsageOttawaPaiutePakistaniPalestinianPanamanianParaguayanPennsylvania GermanPeruvianPimaPolishPortuguesePotawatomiPuebloPuerto RicanPuget Sound SalishRomanianRussianSalvadoranSamoanScandinavianScotch-IrishScottishSeminoleSenegaleseSerbianShoshoneSierra LeoneanSiouxSlavicSlovakSloveneSomaliSouth AfricanSouth AmericanSouth American IndianSoviet UnionSpaniardSpanishSpanish AmericanSpanish American IndianSri LankanSubsaharan AfricanSudaneseSwedishSwissSyrianTaiwaneseThaiTlingit-HaidaTohono O'OdhamTonganTrinidadian and TobagonianTsimshianTurkishU.S. Virgin IslanderUgandanUkrainianUruguayanUteVenezuelanVietnameseWelshWest IndianYakamaYaquiYugoslavianYumanYup'ikZimbabwean
Immigration
NonimmigrantsImmigrantsAfghanistanAfricaAlbaniaArgentinaArmeniaAsiaAustraliaAustriaBahamasBangladeshBarbadosBelarusBelgiumBelizeBoliviaBosnia and HerzegovinaBrazilBulgariaBurma/MyanmarCabo VerdeCambodiaCameroonCanadaCaribbeanCentral AmericaChileChinaColombiaCongoCosta RicaCroatiaCubaCzechoslovakiaDenmarkDominicaDominican RepublicEastern AfricaEastern AsiaEastern EuropeEcuadorEgyptEl SalvadorEnglandEritreaEthiopiaEuropeFijiFranceGermanyGhanaGreeceGrenadaGuatemalaGuyanaHaitiHondurasHong KongHungaryIndiaIndonesiaIranIrelandIsraelItalyJamaicaJapanJordanKazakhstanKenyaKoreaKuwaitLaosLatin AmericaLatviaLebanonLiberiaLithuaniaMalaysiaMexicoMicronesiaMiddle AfricaMoldovaMoroccoNepalNetherlandsNicaraguaNigeriaNorth AmericaNorth MacedoniaNorthern AfricaNorthern EuropeNorwayOceaniaPakistanPanamaPeruPhilippinesPolandPortugalRomaniaRussiaSaudi ArabiaScotlandSenegalSerbiaSierra LeoneSingaporeSomaliaSouth AfricaSouth AmericaSouth Central AsiaSouth Eastern AsiaSouthern EuropeSpainSri LankaSt. Vincent and the GrenadinesSudanSwedenSwitzerlandSyriaTaiwanThailandTrinidad and TobagoTurkeyUgandaUkraineUruguayUzbekistanVenezuelaVietnamWest IndiesWestern AfricaWestern AsiaWestern EuropeYemenZaireZimbabweAzores
Immigrants from Iraq
Race
Ancestry
AfghanAfricanAlaska NativeAlaskan AthabascanAlbanianAleutAlsatianAmericanApacheArabArapahoArgentineanArmenianAssyrian/Chaldean/SyriacAustralianAustrianBahamianBangladeshiBarbadianBasqueBelgianBelizeanBermudanBhutaneseBlackfeetBolivianBrazilianBritishBritish West IndianBulgarianBurmeseCajunCambodianCanadianCape VerdeanCarpatho RusynCelticCentral AmericanCentral American IndianCherokeeCheyenneChickasawChileanChineseChippewaChoctawColombianColvilleComancheCosta RicanCreeCreekCroatianCrowCubanCypriotCzechCzechoslovakianDanishDelawareDominicanDutchDutch West IndianEastern EuropeanEcuadorianEgyptianEnglishEstonianEthiopianEuropeanFijianFilipinoFinnishFrenchFrench American IndianFrench CanadianGermanGerman RussianGhanaianGreekGuamanian/ChamorroGuatemalanGuyaneseHaitianHmongHonduranHopiHoumaHungarianIcelanderIndian (Asian)IndonesianInupiatIranianIraqiIrishIroquoisIsraeliItalianJamaicanJapaneseJordanianKenyanKiowaKoreanLaotianLatvianLebaneseLiberianLithuanianLumbeeLuxembourgerMacedonianMalaysianMalteseMarshalleseMenomineeMexicanMexican American IndianMongolianMoroccanNative HawaiianNavajoNepaleseNew ZealanderNicaraguanNigerianNorthern EuropeanNorwegianOkinawanOsageOttawaPaiutePakistaniPalestinianPanamanianParaguayanPennsylvania GermanPeruvianPimaPolishPortuguesePotawatomiPuebloPuerto RicanPuget Sound SalishRomanianRussianSalvadoranSamoanScandinavianScotch-IrishScottishSeminoleSenegaleseSerbianShoshoneSierra LeoneanSiouxSlavicSlovakSloveneSomaliSouth AfricanSouth AmericanSouth American IndianSoviet UnionSpaniardSpanishSpanish AmericanSpanish American IndianSri LankanSubsaharan AfricanSudaneseSwedishSwissSyrianTaiwaneseThaiTlingit-HaidaTohono O'OdhamTonganTrinidadian and TobagonianTsimshianTurkishU.S. Virgin IslanderUgandanUkrainianUruguayanUteVenezuelanVietnameseWelshWest IndianYakamaYaquiYugoslavianYumanYup'ikZimbabwean
Immigration
NonimmigrantsImmigrantsAfghanistanAfricaAlbaniaArgentinaArmeniaAsiaAustraliaAustriaBahamasBangladeshBarbadosBelarusBelgiumBelizeBoliviaBosnia and HerzegovinaBrazilBulgariaBurma/MyanmarCabo VerdeCambodiaCameroonCanadaCaribbeanCentral AmericaChileChinaColombiaCongoCosta RicaCroatiaCubaCzechoslovakiaDenmarkDominicaDominican RepublicEastern AfricaEastern AsiaEastern EuropeEcuadorEgyptEl SalvadorEnglandEritreaEthiopiaEuropeFijiFranceGermanyGhanaGreeceGrenadaGuatemalaGuyanaHaitiHondurasHong KongHungaryIndiaIndonesiaIranIraqIrelandIsraelItalyJamaicaJapanJordanKazakhstanKenyaKoreaKuwaitLaosLatin AmericaLatviaLebanonLiberiaLithuaniaMalaysiaMexicoMicronesiaMiddle AfricaMoldovaMoroccoNepalNetherlandsNicaraguaNigeriaNorth AmericaNorth MacedoniaNorthern AfricaNorthern EuropeNorwayOceaniaPakistanPanamaPeruPhilippinesPolandPortugalRomaniaRussiaSaudi ArabiaScotlandSenegalSerbiaSierra LeoneSingaporeSomaliaSouth AfricaSouth AmericaSouth Central AsiaSouth Eastern AsiaSouthern EuropeSpainSri LankaSt. Vincent and the GrenadinesSudanSwedenSwitzerlandSyriaTaiwanThailandTrinidad and TobagoTurkeyUgandaUkraineUruguayUzbekistanVenezuelaVietnamWest IndiesWestern AsiaWestern EuropeYemenZaireZimbabweAzores
In Labor Force | Age 16-19
Income
Poverty
Unemployment
Labor Participation
Family Structure
Vehicle Availability
Education Level
Disability

In Labor Force | Age 16-19 Comparison

Immigrants from Western Africa

Immigrants from Iraq

Good
Exceptional
36.9%
IN LABOR FORCE | AGE 16-19
66.7/ 100
METRIC RATING
166th/ 347
METRIC RANK
39.4%
IN LABOR FORCE | AGE 16-19
99.8/ 100
METRIC RATING
80th/ 347
METRIC RANK

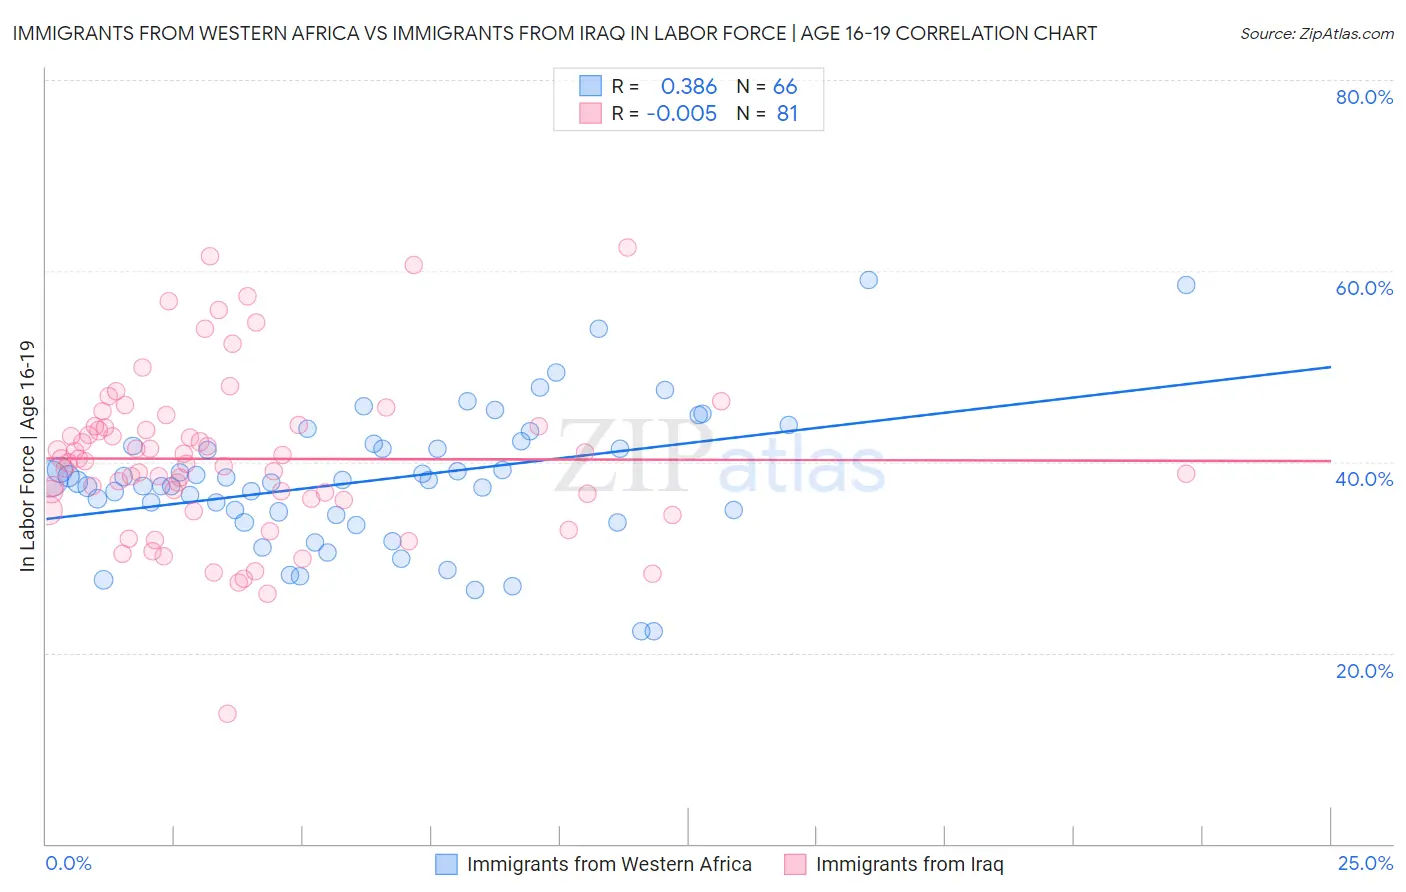
Immigrants from Western Africa vs Immigrants from Iraq In Labor Force | Age 16-19 Correlation Chart

The statistical analysis conducted on geographies consisting of 357,569,133 people shows a mild positive correlation between the proportion of Immigrants from Western Africa and labor force participation rate among population between the ages 16 and 19 in the United States with a correlation coefficient (R) of 0.386 and weighted average of 36.9%. Similarly, the statistical analysis conducted on geographies consisting of 194,717,275 people shows no correlation between the proportion of Immigrants from Iraq and labor force participation rate among population between the ages 16 and 19 in the United States with a correlation coefficient (R) of -0.005 and weighted average of 39.4%, a difference of 6.8%.
Immigrants from Western Africa vs Immigrants from Iraq In Labor Force | Age 16-19

In Labor Force | Age 16-19 Correlation Summary

MeasurementImmigrants from Western AfricaImmigrants from Iraq
Minimum22.2%13.6%
Maximum59.1%62.4%
Range36.9%48.8%
Mean38.1%40.3%
Median38.0%40.0%
Interquartile 25% (IQ1)34.4%36.1%
Interquartile 75% (IQ3)41.7%43.7%
Interquartile Range (IQR)7.3%7.6%
Standard Deviation (Sample)7.3%8.5%
Standard Deviation (Population)7.2%8.5%

Similar Demographics by In Labor Force | Age 16-19

Demographics Similar to Immigrants from Western Africa by In Labor Force | Age 16-19

In terms of in labor force | age 16-19, the demographic groups most similar to Immigrants from Western Africa are Yakama (36.9%, a difference of 0.010%), Immigrants from Kuwait (36.9%, a difference of 0.12%), Bermudan (36.9%, a difference of 0.15%), Immigrants from Jordan (36.9%, a difference of 0.16%), and Arab (36.8%, a difference of 0.17%).
DemographicsRating | RankIn Labor Force | Age 16-19
Yaqui
74.4
/100
|
#159
Good
37.1%
Immigrants | Saudi Arabia
73.9
/100
|
#160
Good
37.0%
Cambodians
71.5
/100
|
#161
Good
37.0%
Immigrants | Jordan
69.5
/100
|
#162
Good
36.9%
Bermudans
69.3
/100
|
#163
Good
36.9%
Immigrants | Kuwait
68.9
/100
|
#164
Good
36.9%
Yakama
66.9
/100
|
#165
Good
36.9%
Immigrants | Western Africa
66.7
/100
|
#166
Good
36.9%
Arabs
63.6
/100
|
#167
Good
36.8%
Palestinians
63.1
/100
|
#168
Good
36.8%
Immigrants | Latvia
61.6
/100
|
#169
Good
36.8%
Immigrants | South Africa
60.5
/100
|
#170
Good
36.8%
Immigrants | Cambodia
58.4
/100
|
#171
Average
36.7%
South Africans
58.3
/100
|
#172
Average
36.7%
Russians
57.5
/100
|
#173
Average
36.7%

Demographics Similar to Immigrants from Iraq by In Labor Force | Age 16-19

In terms of in labor force | age 16-19, the demographic groups most similar to Immigrants from Iraq are Marshallese (39.5%, a difference of 0.18%), Shoshone (39.3%, a difference of 0.28%), Austrian (39.5%, a difference of 0.31%), Basque (39.3%, a difference of 0.34%), and Spanish (39.3%, a difference of 0.36%).
DemographicsRating | RankIn Labor Force | Age 16-19
Immigrants | Middle Africa
99.9
/100
|
#73
Exceptional
39.9%
Hungarians
99.9
/100
|
#74
Exceptional
39.8%
French American Indians
99.9
/100
|
#75
Exceptional
39.8%
Malaysians
99.9
/100
|
#76
Exceptional
39.7%
Immigrants | Portugal
99.9
/100
|
#77
Exceptional
39.7%
Austrians
99.8
/100
|
#78
Exceptional
39.5%
Marshallese
99.8
/100
|
#79
Exceptional
39.5%
Immigrants | Iraq
99.8
/100
|
#80
Exceptional
39.4%
Shoshone
99.7
/100
|
#81
Exceptional
39.3%
Basques
99.7
/100
|
#82
Exceptional
39.3%
Spanish
99.7
/100
|
#83
Exceptional
39.3%
Immigrants | Uganda
99.7
/100
|
#84
Exceptional
39.2%
Creek
99.6
/100
|
#85
Exceptional
39.1%
Samoans
99.6
/100
|
#86
Exceptional
39.1%
Immigrants | Germany
99.6
/100
|
#87
Exceptional
39.1%