Immigrants from Turkey vs French Canadian In Labor Force | Age 20-64
COMPARE
Immigrants from Turkey
French Canadian
In Labor Force | Age 20-64
In Labor Force | Age 20-64 Comparison
Immigrants from Turkey
French Canadians
80.2%
IN LABOR FORCE | AGE 20-64
98.5/ 100
METRIC RATING
70th/ 347
METRIC RANK
79.2%
IN LABOR FORCE | AGE 20-64
8.4/ 100
METRIC RATING
219th/ 347
METRIC RANK
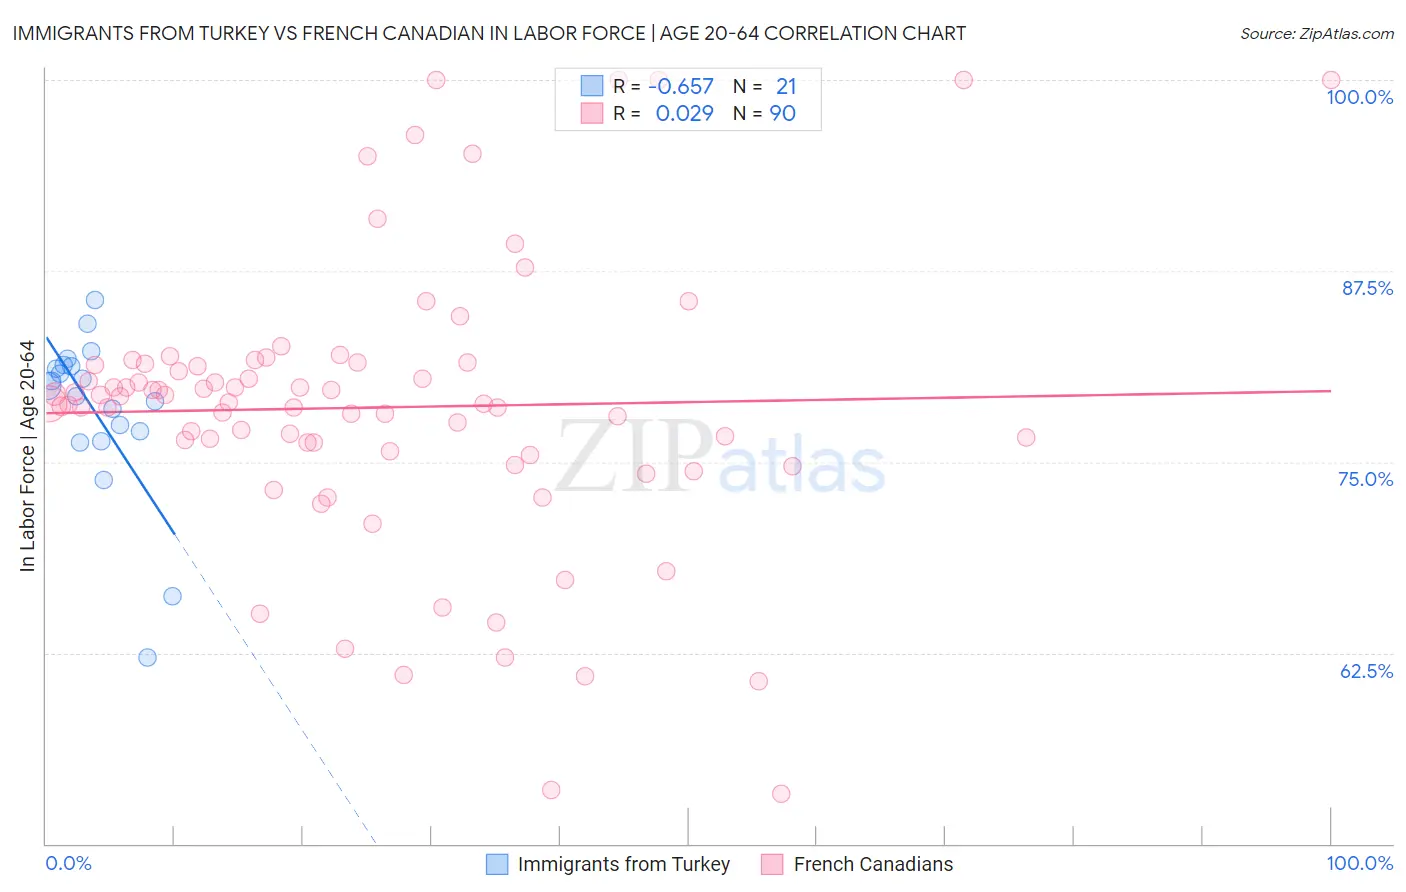
Immigrants from Turkey vs French Canadian In Labor Force | Age 20-64 Correlation Chart
The statistical analysis conducted on geographies consisting of 223,052,749 people shows a significant negative correlation between the proportion of Immigrants from Turkey and labor force participation rate among population between the ages 20 and 64 in the United States with a correlation coefficient (R) of -0.657 and weighted average of 80.2%. Similarly, the statistical analysis conducted on geographies consisting of 502,678,468 people shows no correlation between the proportion of French Canadians and labor force participation rate among population between the ages 20 and 64 in the United States with a correlation coefficient (R) of 0.029 and weighted average of 79.2%, a difference of 1.3%.
In Labor Force | Age 20-64 Correlation Summary
| Measurement | Immigrants from Turkey | French Canadian |
| Minimum | 62.2% | 53.3% |
| Maximum | 85.6% | 100.0% |
| Range | 23.4% | 46.7% |
| Mean | 78.3% | 78.6% |
| Median | 80.0% | 78.8% |
| Interquartile 25% (IQ1) | 76.7% | 75.7% |
| Interquartile 75% (IQ3) | 81.3% | 81.4% |
| Interquartile Range (IQR) | 4.6% | 5.7% |
| Standard Deviation (Sample) | 5.5% | 9.3% |
| Standard Deviation (Population) | 5.3% | 9.2% |
Similar Demographics by In Labor Force | Age 20-64
Demographics Similar to Immigrants from Turkey by In Labor Force | Age 20-64
In terms of in labor force | age 20-64, the demographic groups most similar to Immigrants from Turkey are Bhutanese (80.2%, a difference of 0.0%), Albanian (80.2%, a difference of 0.0%), Taiwanese (80.2%, a difference of 0.010%), Soviet Union (80.2%, a difference of 0.010%), and Lithuanian (80.2%, a difference of 0.020%).
| Demographics | Rating | Rank | In Labor Force | Age 20-64 |
| Immigrants | Korea | 98.8 /100 | #63 | Exceptional 80.3% |
| Immigrants | Albania | 98.7 /100 | #64 | Exceptional 80.3% |
| Lithuanians | 98.7 /100 | #65 | Exceptional 80.2% |
| Macedonians | 98.7 /100 | #66 | Exceptional 80.2% |
| Taiwanese | 98.6 /100 | #67 | Exceptional 80.2% |
| Bhutanese | 98.6 /100 | #68 | Exceptional 80.2% |
| Albanians | 98.6 /100 | #69 | Exceptional 80.2% |
| Immigrants | Turkey | 98.5 /100 | #70 | Exceptional 80.2% |
| Soviet Union | 98.5 /100 | #71 | Exceptional 80.2% |
| Eastern Europeans | 98.4 /100 | #72 | Exceptional 80.2% |
| Cypriots | 98.2 /100 | #73 | Exceptional 80.2% |
| Immigrants | Eastern Europe | 98.1 /100 | #74 | Exceptional 80.2% |
| Immigrants | Afghanistan | 97.9 /100 | #75 | Exceptional 80.2% |
| Egyptians | 97.8 /100 | #76 | Exceptional 80.2% |
| Immigrants | Colombia | 97.8 /100 | #77 | Exceptional 80.2% |
Demographics Similar to French Canadians by In Labor Force | Age 20-64
In terms of in labor force | age 20-64, the demographic groups most similar to French Canadians are Immigrants from England (79.2%, a difference of 0.020%), Immigrants (79.2%, a difference of 0.020%), Hungarian (79.2%, a difference of 0.030%), Immigrants from Panama (79.1%, a difference of 0.040%), and Canadian (79.1%, a difference of 0.040%).
| Demographics | Rating | Rank | In Labor Force | Age 20-64 |
| Irish | 13.2 /100 | #212 | Poor 79.3% |
| Immigrants | Portugal | 12.8 /100 | #213 | Poor 79.3% |
| Immigrants | Armenia | 12.2 /100 | #214 | Poor 79.2% |
| Immigrants | Norway | 12.0 /100 | #215 | Poor 79.2% |
| Arabs | 11.4 /100 | #216 | Poor 79.2% |
| Immigrants | Western Asia | 11.0 /100 | #217 | Poor 79.2% |
| Immigrants | England | 9.3 /100 | #218 | Tragic 79.2% |
| French Canadians | 8.4 /100 | #219 | Tragic 79.2% |
| Immigrants | Immigrants | 7.7 /100 | #220 | Tragic 79.2% |
| Hungarians | 7.2 /100 | #221 | Tragic 79.2% |
| Immigrants | Panama | 6.9 /100 | #222 | Tragic 79.1% |
| Canadians | 6.8 /100 | #223 | Tragic 79.1% |
| Immigrants | Uzbekistan | 6.8 /100 | #224 | Tragic 79.1% |
| Portuguese | 6.4 /100 | #225 | Tragic 79.1% |
| Central Americans | 5.9 /100 | #226 | Tragic 79.1% |