Immigrants from Thailand vs Immigrants from Eastern Asia In Labor Force | Age 16-19
COMPARE
Immigrants from Thailand
Immigrants from Eastern Asia
In Labor Force | Age 16-19
In Labor Force | Age 16-19 Comparison
Immigrants from Thailand
Immigrants from Eastern Asia
38.7%
IN LABOR FORCE | AGE 16-19
99.1/ 100
METRIC RATING
100th/ 347
METRIC RANK
32.0%
IN LABOR FORCE | AGE 16-19
0.0/ 100
METRIC RATING
309th/ 347
METRIC RANK
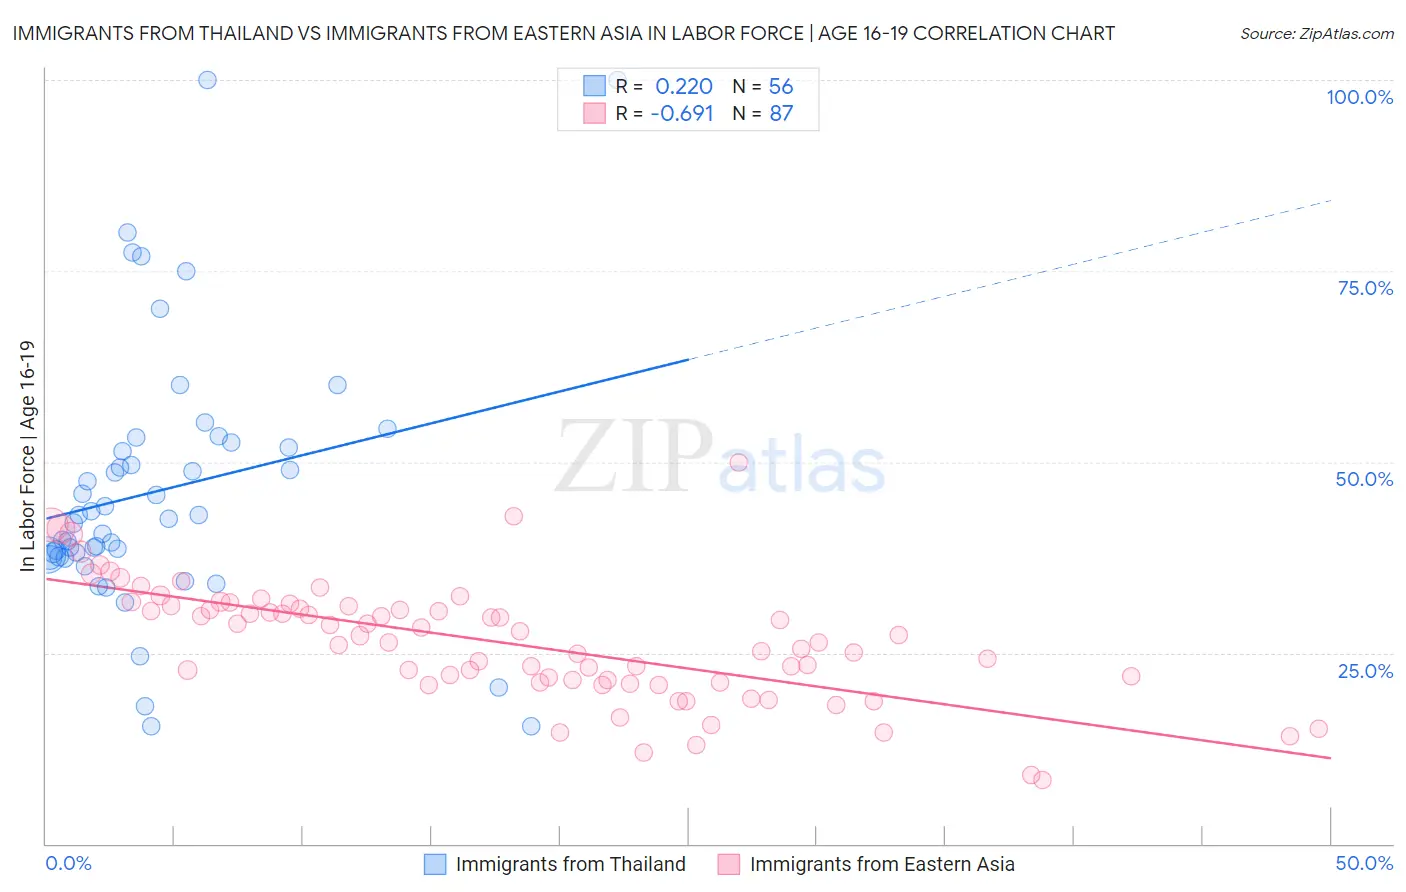
Immigrants from Thailand vs Immigrants from Eastern Asia In Labor Force | Age 16-19 Correlation Chart
The statistical analysis conducted on geographies consisting of 316,722,585 people shows a weak positive correlation between the proportion of Immigrants from Thailand and labor force participation rate among population between the ages 16 and 19 in the United States with a correlation coefficient (R) of 0.220 and weighted average of 38.7%. Similarly, the statistical analysis conducted on geographies consisting of 498,676,879 people shows a significant negative correlation between the proportion of Immigrants from Eastern Asia and labor force participation rate among population between the ages 16 and 19 in the United States with a correlation coefficient (R) of -0.691 and weighted average of 32.0%, a difference of 21.0%.
In Labor Force | Age 16-19 Correlation Summary
| Measurement | Immigrants from Thailand | Immigrants from Eastern Asia |
| Minimum | 15.4% | 8.3% |
| Maximum | 100.0% | 50.0% |
| Range | 84.6% | 41.7% |
| Mean | 46.3% | 26.4% |
| Median | 42.8% | 26.4% |
| Interquartile 25% (IQ1) | 37.7% | 21.2% |
| Interquartile 75% (IQ3) | 52.2% | 31.2% |
| Interquartile Range (IQR) | 14.5% | 10.0% |
| Standard Deviation (Sample) | 17.4% | 7.7% |
| Standard Deviation (Population) | 17.3% | 7.7% |
Similar Demographics by In Labor Force | Age 16-19
Demographics Similar to Immigrants from Thailand by In Labor Force | Age 16-19
In terms of in labor force | age 16-19, the demographic groups most similar to Immigrants from Thailand are Hmong (38.7%, a difference of 0.070%), Zimbabwean (38.7%, a difference of 0.070%), Immigrants from Cameroon (38.7%, a difference of 0.11%), Immigrants from Eritrea (38.7%, a difference of 0.16%), and Immigrants from North Macedonia (38.9%, a difference of 0.29%).
| Demographics | Rating | Rank | In Labor Force | Age 16-19 |
| Blackfeet | 99.4 /100 | #93 | Exceptional 38.9% |
| Immigrants | Canada | 99.4 /100 | #94 | Exceptional 38.9% |
| Immigrants | North America | 99.4 /100 | #95 | Exceptional 38.9% |
| Latvians | 99.4 /100 | #96 | Exceptional 38.9% |
| Greeks | 99.3 /100 | #97 | Exceptional 38.9% |
| Ugandans | 99.3 /100 | #98 | Exceptional 38.9% |
| Immigrants | North Macedonia | 99.3 /100 | #99 | Exceptional 38.9% |
| Immigrants | Thailand | 99.1 /100 | #100 | Exceptional 38.7% |
| Hmong | 99.1 /100 | #101 | Exceptional 38.7% |
| Zimbabweans | 99.1 /100 | #102 | Exceptional 38.7% |
| Immigrants | Cameroon | 99.0 /100 | #103 | Exceptional 38.7% |
| Immigrants | Eritrea | 99.0 /100 | #104 | Exceptional 38.7% |
| Iraqis | 98.9 /100 | #105 | Exceptional 38.6% |
| Delaware | 98.8 /100 | #106 | Exceptional 38.6% |
| Chinese | 98.8 /100 | #107 | Exceptional 38.6% |
Demographics Similar to Immigrants from Eastern Asia by In Labor Force | Age 16-19
In terms of in labor force | age 16-19, the demographic groups most similar to Immigrants from Eastern Asia are Immigrants from Iran (32.0%, a difference of 0.14%), Navajo (32.1%, a difference of 0.18%), Indian (Asian) (31.9%, a difference of 0.50%), Immigrants from Jamaica (32.2%, a difference of 0.53%), and Immigrants from Belize (31.8%, a difference of 0.65%).
| Demographics | Rating | Rank | In Labor Force | Age 16-19 |
| Belizeans | 0.0 /100 | #302 | Tragic 32.8% |
| Immigrants | Dominica | 0.0 /100 | #303 | Tragic 32.5% |
| Israelis | 0.0 /100 | #304 | Tragic 32.4% |
| Nicaraguans | 0.0 /100 | #305 | Tragic 32.4% |
| Spanish American Indians | 0.0 /100 | #306 | Tragic 32.4% |
| Immigrants | Jamaica | 0.0 /100 | #307 | Tragic 32.2% |
| Navajo | 0.0 /100 | #308 | Tragic 32.1% |
| Immigrants | Eastern Asia | 0.0 /100 | #309 | Tragic 32.0% |
| Immigrants | Iran | 0.0 /100 | #310 | Tragic 32.0% |
| Indians (Asian) | 0.0 /100 | #311 | Tragic 31.9% |
| Immigrants | Belize | 0.0 /100 | #312 | Tragic 31.8% |
| Hopi | 0.0 /100 | #313 | Tragic 31.8% |
| Cubans | 0.0 /100 | #314 | Tragic 31.8% |
| Immigrants | West Indies | 0.0 /100 | #315 | Tragic 31.7% |
| Filipinos | 0.0 /100 | #316 | Tragic 31.7% |