Immigrants from Thailand vs Armenian In Labor Force | Age 20-64
COMPARE
Immigrants from Thailand
Armenian
In Labor Force | Age 20-64
In Labor Force | Age 20-64 Comparison
Immigrants from Thailand
Armenians
79.4%
IN LABOR FORCE | AGE 20-64
24.8/ 100
METRIC RATING
194th/ 347
METRIC RANK
79.5%
IN LABOR FORCE | AGE 20-64
41.4/ 100
METRIC RATING
179th/ 347
METRIC RANK
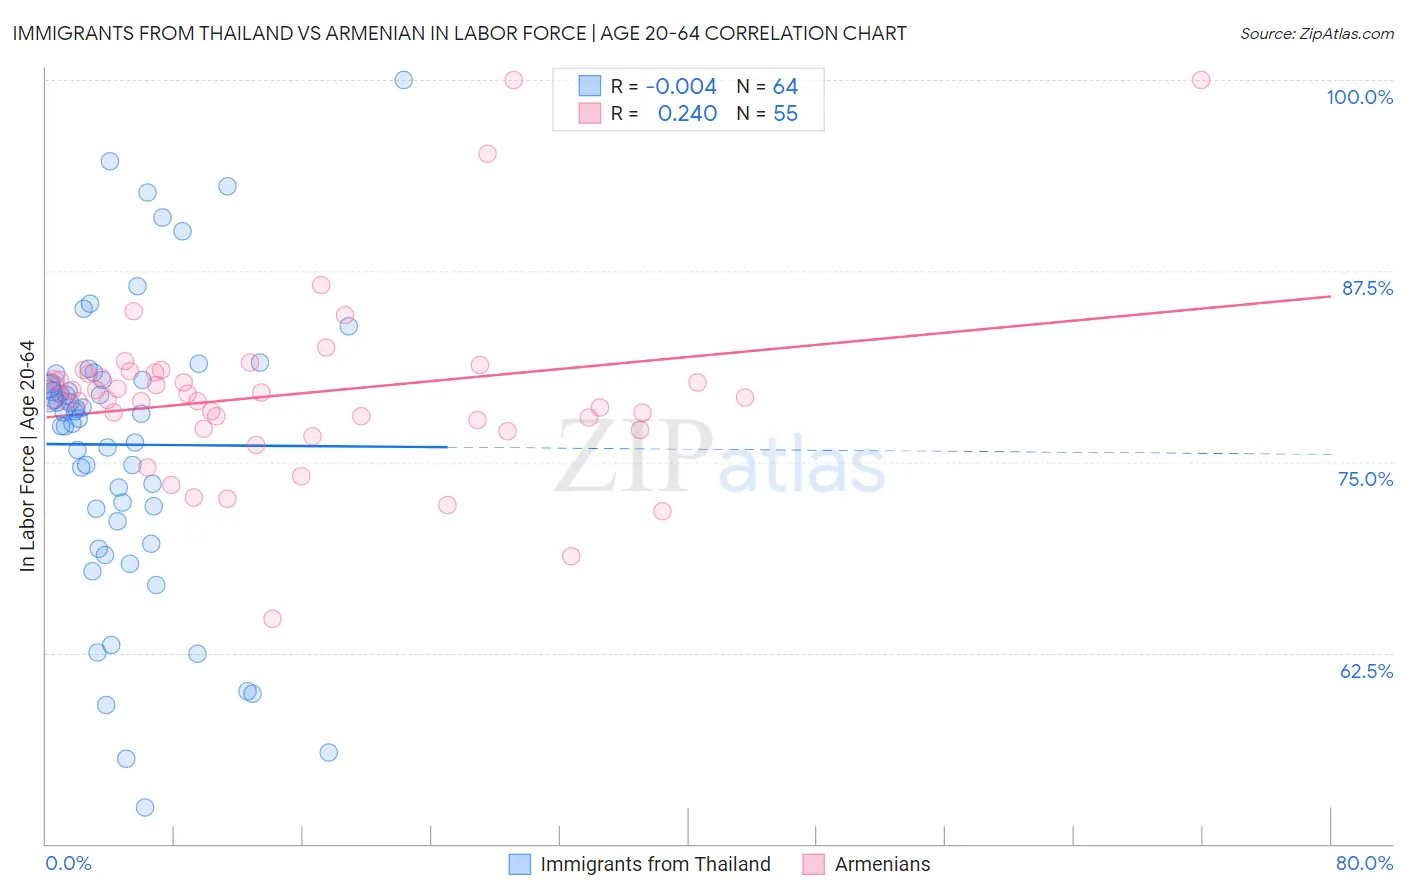
Immigrants from Thailand vs Armenian In Labor Force | Age 20-64 Correlation Chart
The statistical analysis conducted on geographies consisting of 317,022,892 people shows no correlation between the proportion of Immigrants from Thailand and labor force participation rate among population between the ages 20 and 64 in the United States with a correlation coefficient (R) of -0.004 and weighted average of 79.4%. Similarly, the statistical analysis conducted on geographies consisting of 310,959,496 people shows a weak positive correlation between the proportion of Armenians and labor force participation rate among population between the ages 20 and 64 in the United States with a correlation coefficient (R) of 0.240 and weighted average of 79.5%, a difference of 0.15%.
In Labor Force | Age 20-64 Correlation Summary
| Measurement | Immigrants from Thailand | Armenian |
| Minimum | 52.4% | 64.7% |
| Maximum | 100.0% | 100.0% |
| Range | 47.6% | 35.3% |
| Mean | 76.1% | 79.5% |
| Median | 78.2% | 79.2% |
| Interquartile 25% (IQ1) | 71.5% | 77.1% |
| Interquartile 75% (IQ3) | 80.4% | 80.9% |
| Interquartile Range (IQR) | 8.9% | 3.7% |
| Standard Deviation (Sample) | 9.5% | 5.9% |
| Standard Deviation (Population) | 9.5% | 5.9% |
Demographics Similar to Immigrants from Thailand and Armenians by In Labor Force | Age 20-64
In terms of in labor force | age 20-64, the demographic groups most similar to Immigrants from Thailand are Indonesian (79.4%, a difference of 0.010%), Immigrants from Austria (79.4%, a difference of 0.010%), Immigrants from Denmark (79.4%, a difference of 0.020%), Ecuadorian (79.4%, a difference of 0.020%), and Swiss (79.4%, a difference of 0.040%). Similarly, the demographic groups most similar to Armenians are Salvadoran (79.5%, a difference of 0.0%), Czechoslovakian (79.5%, a difference of 0.020%), Immigrants from Netherlands (79.5%, a difference of 0.030%), Immigrants from Saudi Arabia (79.5%, a difference of 0.030%), and Australian (79.5%, a difference of 0.040%).
| Demographics | Rating | Rank | In Labor Force | Age 20-64 |
| Australians | 46.0 /100 | #176 | Average 79.5% |
| Immigrants | Netherlands | 45.2 /100 | #177 | Average 79.5% |
| Czechoslovakians | 44.3 /100 | #178 | Average 79.5% |
| Armenians | 41.4 /100 | #179 | Average 79.5% |
| Salvadorans | 41.0 /100 | #180 | Average 79.5% |
| Immigrants | Saudi Arabia | 37.7 /100 | #181 | Fair 79.5% |
| Malaysians | 37.1 /100 | #182 | Fair 79.5% |
| Immigrants | Hungary | 36.8 /100 | #183 | Fair 79.5% |
| Finns | 35.9 /100 | #184 | Fair 79.5% |
| Israelis | 34.7 /100 | #185 | Fair 79.5% |
| Northern Europeans | 34.5 /100 | #186 | Fair 79.5% |
| Assyrians/Chaldeans/Syriacs | 33.3 /100 | #187 | Fair 79.4% |
| Immigrants | Haiti | 32.1 /100 | #188 | Fair 79.4% |
| Immigrants | El Salvador | 30.9 /100 | #189 | Fair 79.4% |
| Immigrants | Syria | 30.8 /100 | #190 | Fair 79.4% |
| Swiss | 28.9 /100 | #191 | Fair 79.4% |
| Immigrants | Denmark | 26.9 /100 | #192 | Fair 79.4% |
| Indonesians | 26.1 /100 | #193 | Fair 79.4% |
| Immigrants | Thailand | 24.8 /100 | #194 | Fair 79.4% |
| Immigrants | Austria | 23.7 /100 | #195 | Fair 79.4% |
| Ecuadorians | 23.1 /100 | #196 | Fair 79.4% |