Immigrants from St. Vincent and the Grenadines vs Immigrants from Germany In Labor Force | Age 30-34
COMPARE
Immigrants from St. Vincent and the Grenadines
Immigrants from Germany
In Labor Force | Age 30-34
In Labor Force | Age 30-34 Comparison
Immigrants from St. Vincent and the Grenadines
Immigrants from Germany
83.9%
IN LABOR FORCE | AGE 30-34
0.5/ 100
METRIC RATING
254th/ 347
METRIC RANK
84.3%
IN LABOR FORCE | AGE 30-34
7.2/ 100
METRIC RATING
214th/ 347
METRIC RANK
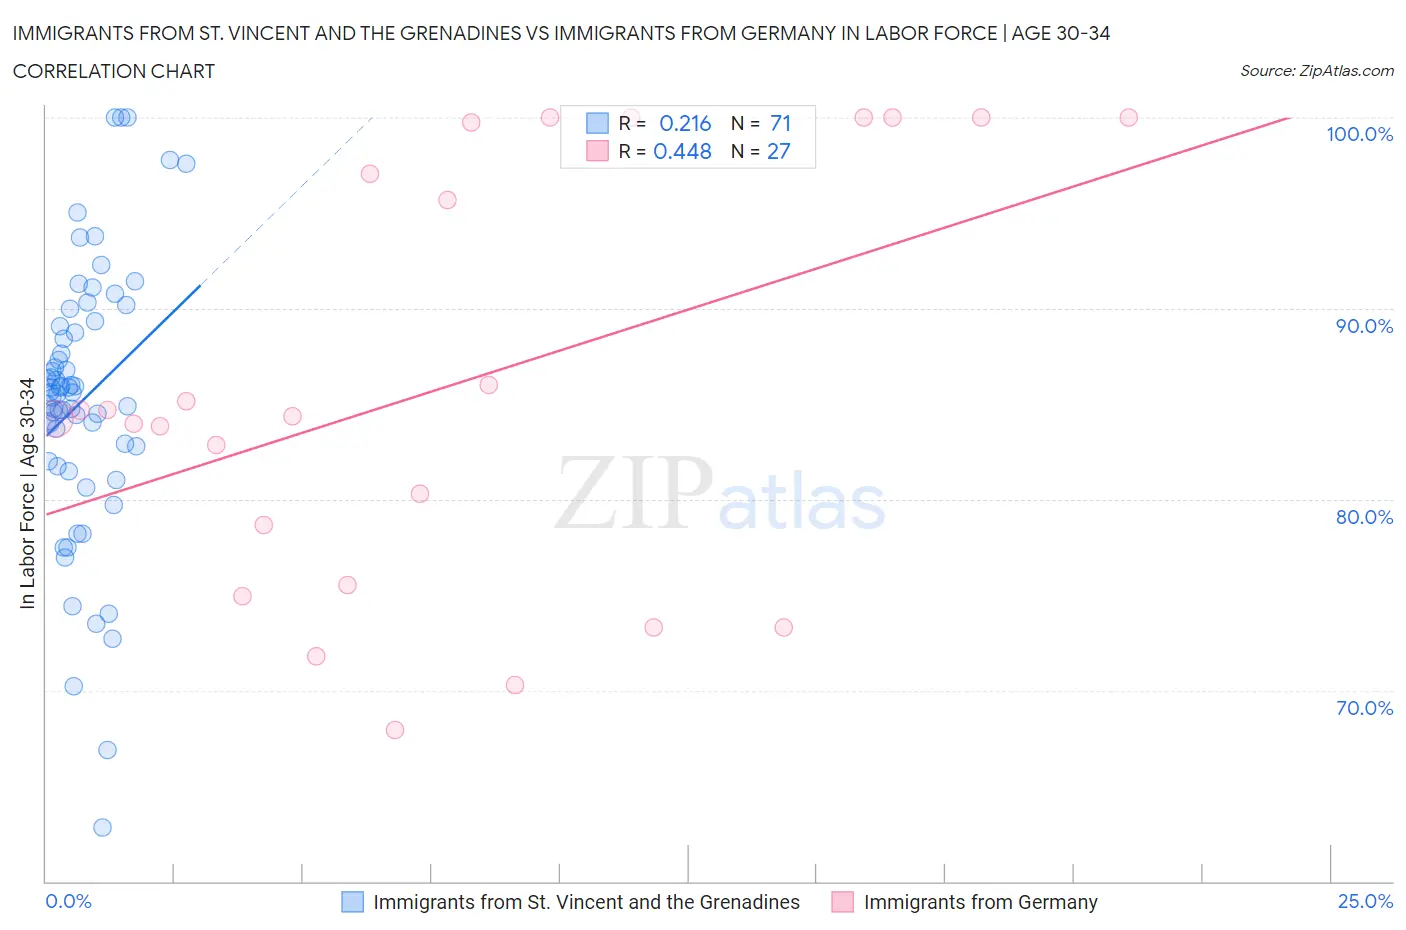
Immigrants from St. Vincent and the Grenadines vs Immigrants from Germany In Labor Force | Age 30-34 Correlation Chart
The statistical analysis conducted on geographies consisting of 56,189,108 people shows a weak positive correlation between the proportion of Immigrants from St. Vincent and the Grenadines and labor force participation rate among population between the ages 30 and 34 in the United States with a correlation coefficient (R) of 0.216 and weighted average of 83.9%. Similarly, the statistical analysis conducted on geographies consisting of 463,598,639 people shows a moderate positive correlation between the proportion of Immigrants from Germany and labor force participation rate among population between the ages 30 and 34 in the United States with a correlation coefficient (R) of 0.448 and weighted average of 84.3%, a difference of 0.48%.
In Labor Force | Age 30-34 Correlation Summary
| Measurement | Immigrants from St. Vincent and the Grenadines | Immigrants from Germany |
| Minimum | 62.8% | 67.9% |
| Maximum | 100.0% | 100.0% |
| Range | 37.2% | 32.1% |
| Mean | 85.2% | 85.9% |
| Median | 85.6% | 84.4% |
| Interquartile 25% (IQ1) | 82.0% | 75.5% |
| Interquartile 75% (IQ3) | 89.1% | 99.7% |
| Interquartile Range (IQR) | 7.1% | 24.2% |
| Standard Deviation (Sample) | 7.1% | 10.8% |
| Standard Deviation (Population) | 7.1% | 10.6% |
Similar Demographics by In Labor Force | Age 30-34
Demographics Similar to Immigrants from St. Vincent and the Grenadines by In Labor Force | Age 30-34
In terms of in labor force | age 30-34, the demographic groups most similar to Immigrants from St. Vincent and the Grenadines are Bahamian (83.9%, a difference of 0.020%), Immigrants from Nicaragua (83.9%, a difference of 0.020%), White/Caucasian (83.9%, a difference of 0.020%), Nicaraguan (83.9%, a difference of 0.030%), and Immigrants from Iraq (83.9%, a difference of 0.040%).
| Demographics | Rating | Rank | In Labor Force | Age 30-34 |
| British West Indians | 0.8 /100 | #247 | Tragic 84.0% |
| Portuguese | 0.8 /100 | #248 | Tragic 84.0% |
| Immigrants | Dominica | 0.7 /100 | #249 | Tragic 84.0% |
| Immigrants | Iraq | 0.7 /100 | #250 | Tragic 83.9% |
| Nicaraguans | 0.6 /100 | #251 | Tragic 83.9% |
| Bahamians | 0.6 /100 | #252 | Tragic 83.9% |
| Immigrants | Nicaragua | 0.6 /100 | #253 | Tragic 83.9% |
| Immigrants | St. Vincent and the Grenadines | 0.5 /100 | #254 | Tragic 83.9% |
| Whites/Caucasians | 0.5 /100 | #255 | Tragic 83.9% |
| Immigrants | Lebanon | 0.4 /100 | #256 | Tragic 83.9% |
| Iraqis | 0.3 /100 | #257 | Tragic 83.8% |
| Hondurans | 0.3 /100 | #258 | Tragic 83.8% |
| Scotch-Irish | 0.3 /100 | #259 | Tragic 83.8% |
| Immigrants | Dominican Republic | 0.3 /100 | #260 | Tragic 83.8% |
| Guyanese | 0.3 /100 | #261 | Tragic 83.8% |
Demographics Similar to Immigrants from Germany by In Labor Force | Age 30-34
In terms of in labor force | age 30-34, the demographic groups most similar to Immigrants from Germany are European (84.3%, a difference of 0.0%), Immigrants from Ecuador (84.3%, a difference of 0.0%), Immigrants from Trinidad and Tobago (84.3%, a difference of 0.010%), Immigrants from Western Asia (84.3%, a difference of 0.020%), and Immigrants from Jamaica (84.3%, a difference of 0.020%).
| Demographics | Rating | Rank | In Labor Force | Age 30-34 |
| Bangladeshis | 9.4 /100 | #207 | Tragic 84.3% |
| Arabs | 8.9 /100 | #208 | Tragic 84.3% |
| Jamaicans | 8.8 /100 | #209 | Tragic 84.3% |
| Indonesians | 8.8 /100 | #210 | Tragic 84.3% |
| Japanese | 8.8 /100 | #211 | Tragic 84.3% |
| Immigrants | Western Asia | 8.2 /100 | #212 | Tragic 84.3% |
| Immigrants | Jamaica | 7.9 /100 | #213 | Tragic 84.3% |
| Immigrants | Germany | 7.2 /100 | #214 | Tragic 84.3% |
| Europeans | 7.2 /100 | #215 | Tragic 84.3% |
| Immigrants | Ecuador | 7.1 /100 | #216 | Tragic 84.3% |
| Immigrants | Trinidad and Tobago | 7.0 /100 | #217 | Tragic 84.3% |
| Immigrants | Panama | 6.3 /100 | #218 | Tragic 84.3% |
| Swiss | 5.8 /100 | #219 | Tragic 84.3% |
| Danes | 5.3 /100 | #220 | Tragic 84.3% |
| Salvadorans | 3.8 /100 | #221 | Tragic 84.2% |